
Go off the grid with your Raspberry Pi Zero W
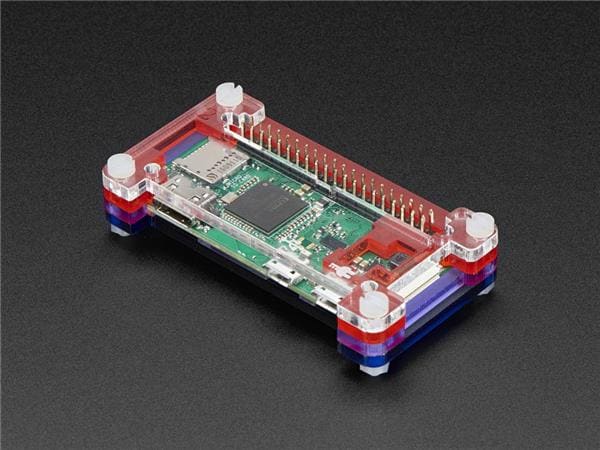
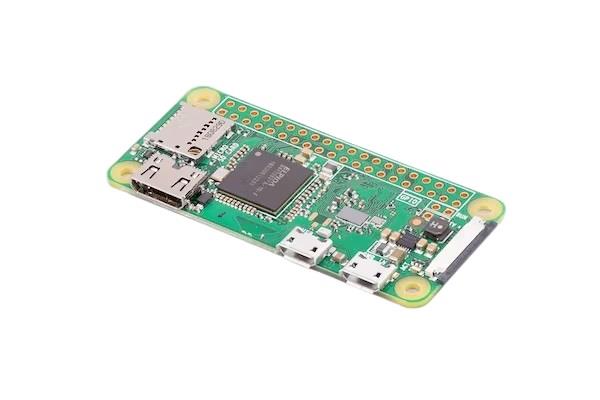
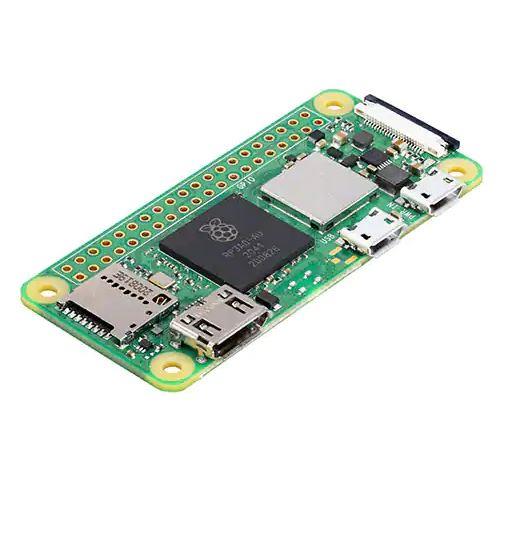
The Raspberry Pi Zero W is a truly wondrous piece of kit. It provides access to the Raspberry Pi learning resources, it is really cheap so we can embed it in a project and forget about it, and it sips away at power, unlike its much larger relatives that guzzle power! But no matter what version you buy, they all need a power supply and that generally comes in the form of a micro USB wall wart. So how can we take our Pi “off the grid” and have it create its own power? Perpetual motion, hamster wheel … solar?
In this project we will use Pi Juice from Pi Supply to add a LiPo battery and solar panel which will be used to power a Raspberry Pi Zero W, connected to WiFi and graphing temperature data using a DS18B20 sensor using the Node-RED language, but don’t worry as Node-RED is super simple to use!
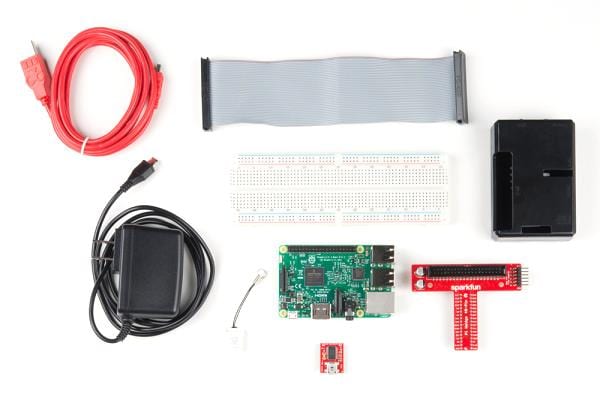
For this project you will need:
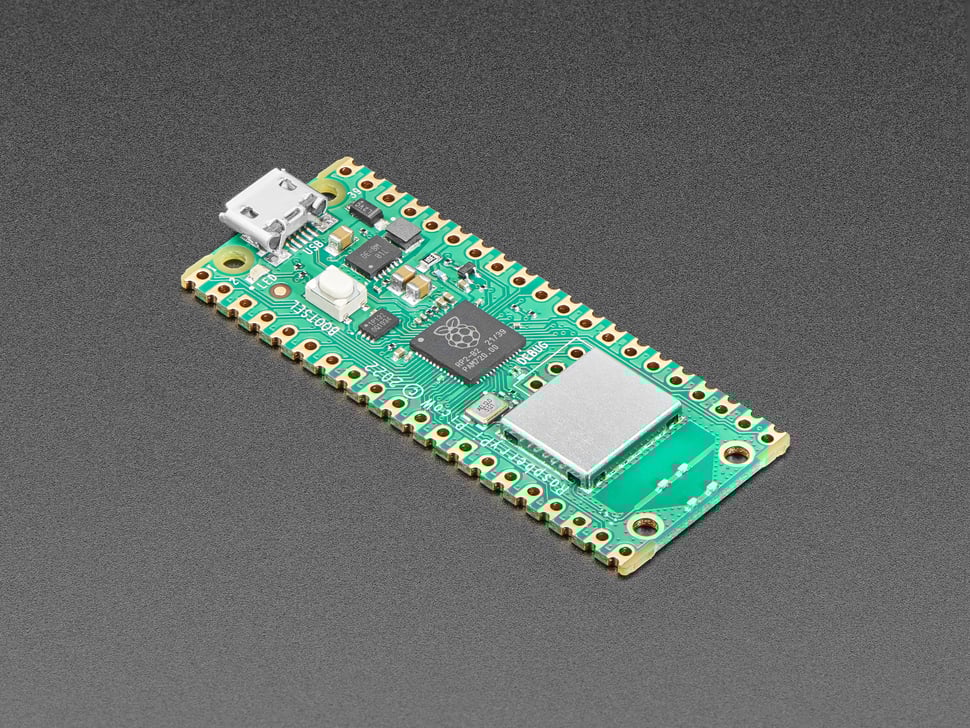
- A Raspberry Pi Zero W and soldered GPIO header
- Micro SD card with the latest Raspbian release.
- A Pi Juice and battery with Pi Juice 40W Solar Panel
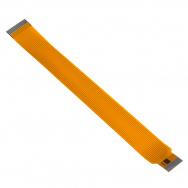
- DS18B20 sensor in protective sleeve
- 4.7K Ohm resistor
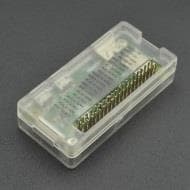
- Screw Terminal
- Breadboard
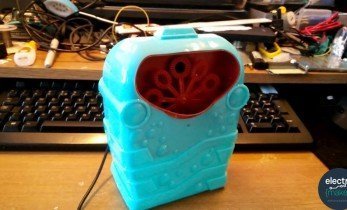
- Waterproof case (IP65 rated or better, IP68 is the ideal)
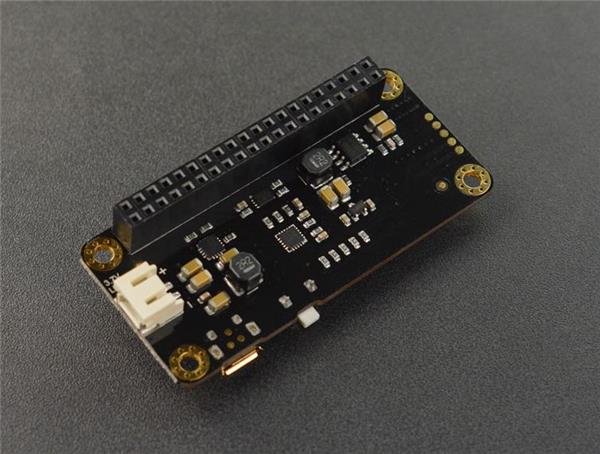
What is Pi Juice?
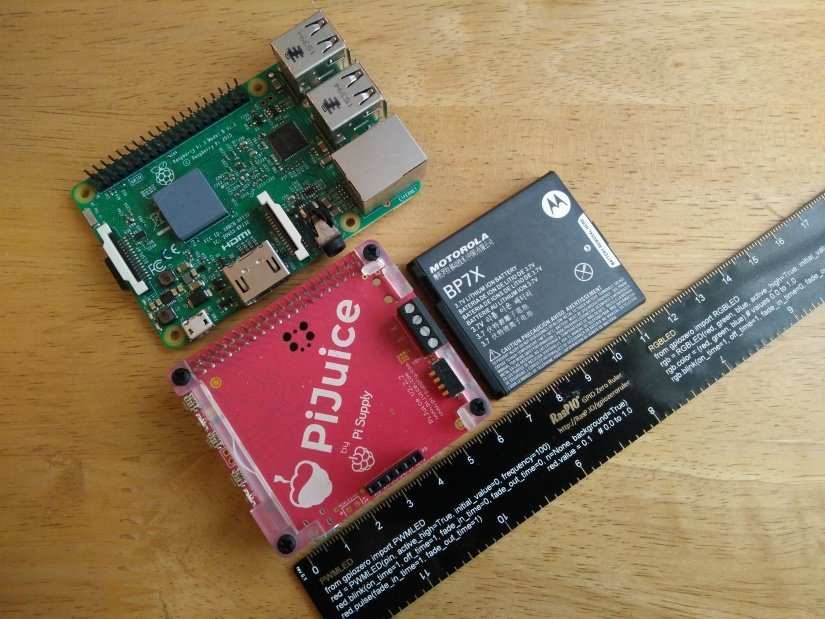
Pi Juice is a power solution for all 40 pin GPIO models of the Raspberry Pi, from the original B+ to Pi Zero W and the new Raspberry Pi 3 B+) it provides an interface (software and hardware) to monitor battery status, in this case a common Motorola Lithium Ion battery, commonly found in mobile/cell devices. Pi Juice fits conveniently on top of the Pi, while still enabling access to all of the GPIO pins. The software is also fully user configurable for example controlling actions when a certain power level is reached. Pi Juice is powered by a micro USB connection that can accept input from many different sources (mains, battery and solar) and the goal of Pi Juice is to enable projects in remote and isolated locations.
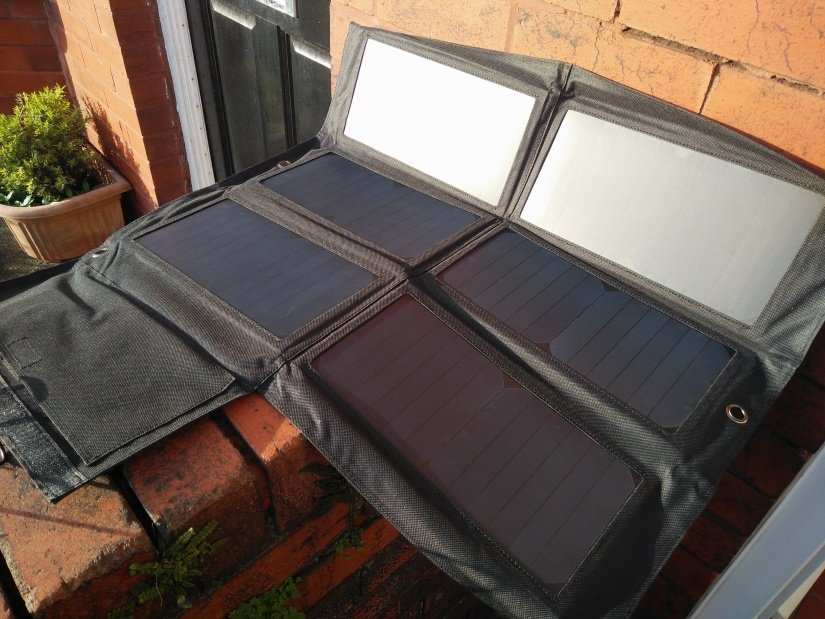
Pi Juice can be used with two solar panels, in this project we have the largest 40W panel providing the power need to top up the battery.
Building the hardware
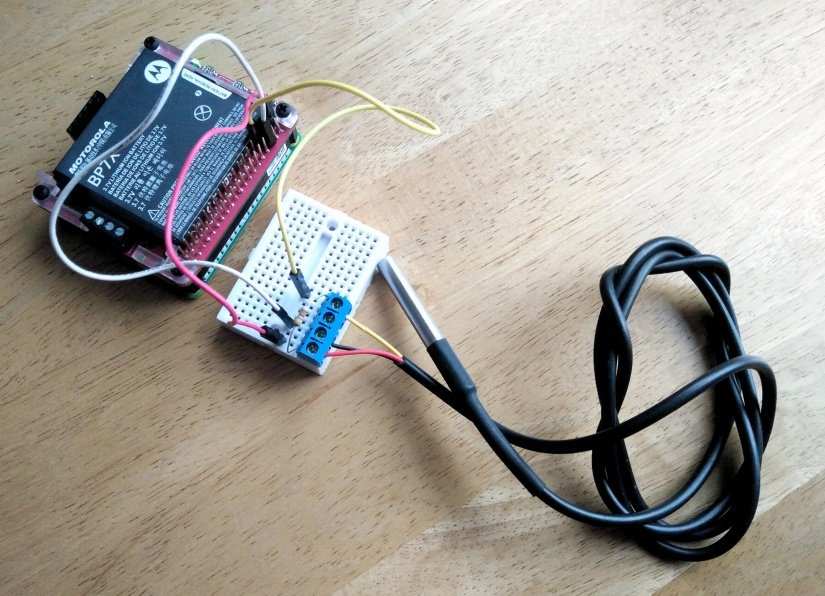
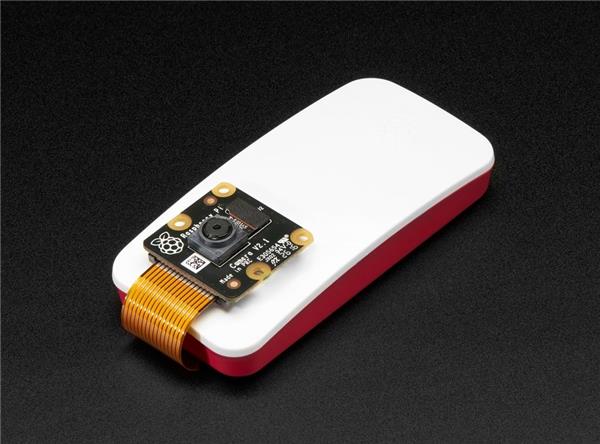
Attaching the Pi Juice to the Pi Zero W to the GPIO is all it takes to connect the Pi Juice ready for use. Inserting the battery into the Pi Juice is also relatively simple, just remember to remove the plastic cover for the battery terminals.
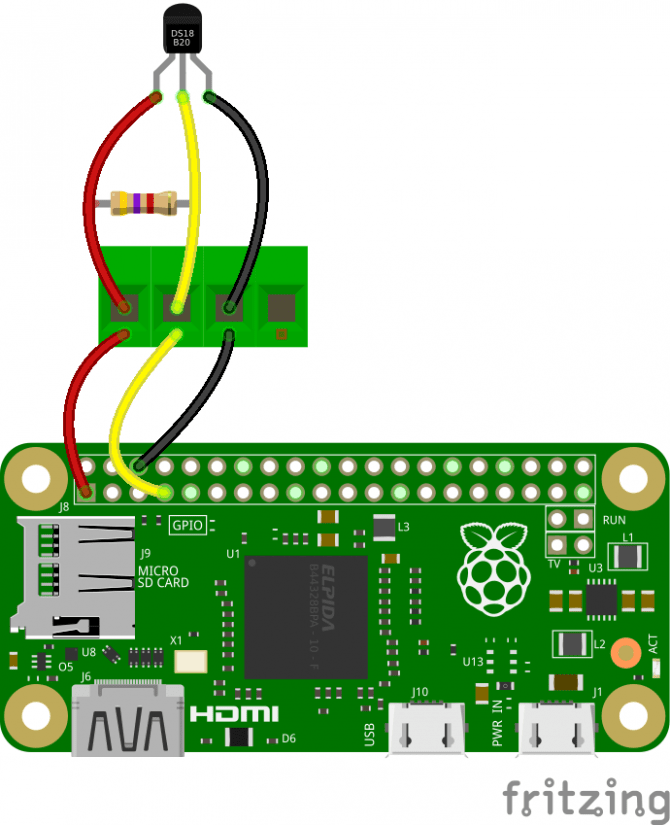
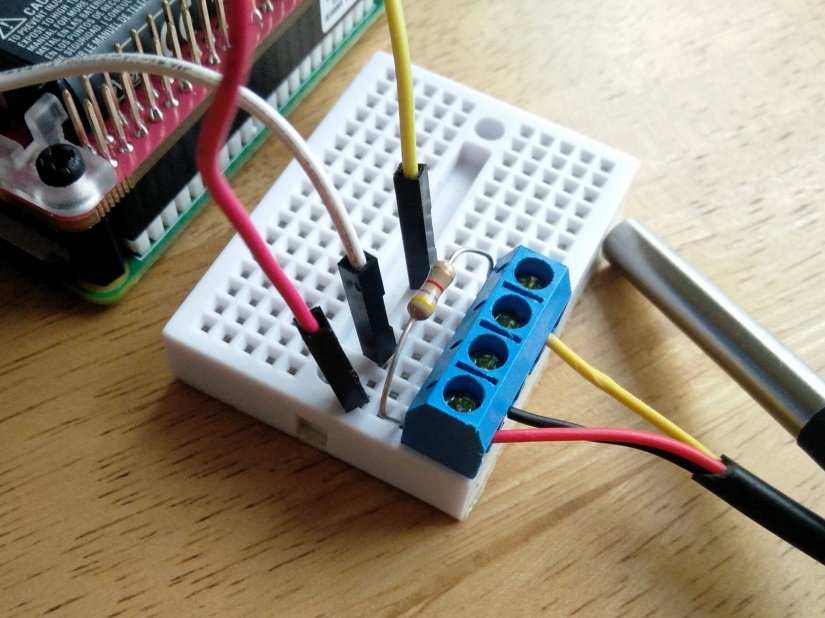
With the Pi Juice installed we now move on to connecting the DS18B20 sensor. To do this we use a breadboard and screw terminal. The DS18B20 has three wires. Red for 3V Vcc, Black for Ground (GND) and Yellow which is for data. So using the screw terminal, secure the wires, one in each terminal. Via the breadboard connect the 3V terminal to the data wire using the 4.7K Ohm resistor, this ensures that we have a consistent data connection. Now using male to female jumper wires, connect the 3V screw terminal to the 3V pin on the Pi Juice GPIO pass through, then do the same for GND. Finally, connect the data pin to GPIO 4 on the GPIO pass through (it is the fourth pin down on the left column.)
Once all the connections are made, connect your keyboard, mouse, mini HDMI to a display, and finally power up your Pi Zero W via the PWR micro USB port on the Pi Zero W. Do not connect power to Pi Juice just yet. Boot up the Pi Zero W to the desktop.
Software Setup - WiFi
Now at the desktop, we need to configure our WiFi so that our Pi automatically connects on boot. To do this we need to go to the Wireless Settings icon in the top right of the screen and single left click to show a list of access points. Choose your access point and from there enter your password to connect.

With our WiFi setup, the next action will ensure our Raspberry Pi Zero W has a consistent IP address so that each time it boots it receives the same IP address. Using the same Wireless Settings icon, but this time we single right click to bring up a menu. Choose “Wired and Wireless Settings” and in the new dialog change the interface to WLAN0, and then enter an IP address in the IPV4 box. Remember to change the IP address to match that of your network. Not sure what your IP address currently is? Hover the mouse over the Wireless Settings icon and it will tell you. When ready click on Apply and then Close to fix the IP address.
Installing the Pi Juice Software
With the networking side of the project completed, we can now start the installation and configuration of our Pi Juice board. In a terminal we will first update the list of software that our Pi Zero W can install, and then we will install the Pi Juice packages. After each line press Enter to start the command, this will take some time to complete, so be patient.
sudo apt update

sudo apt install pijuice-gui 
Once installed, the software is ready to use and can be found in the Preferences menu. While we do not need to do anything else with the software, we can have a poke around and see what the board offers.
When ready, power off the Raspberry Pi Zero W and remove the micro USB power lead from the Zero W and insert it into the micro USB port on the Pi Juice, take note that the port is upside down! By inserting the power into the Pi Juice we will start to charge the Lithium-Ion battery. To power up our Raspberry Pi Zero W, look for SW1 on the Pi Juice, it should be next to an LED. Press it quickly, as if clicking a mouse button, to turn on the Pi. The Pi will boot as normal and take us to the desktop.
Enabling One Wire Serial Interface
One final step we need to take is to ensure that the One Wire Serial Interface is enabled for our DS18B20 to talk to the Raspberry Pi Zero W. To do this we need to go to the Preferences menu and select “Raspberry Pi Configuration” then in the new dialog click on the “Interfaces” tab and then for 1-Wire click on Enable. Press Ok and if prompted to reboot do so and return to the desktop.
Installing Node Package Manager
Node-RED comes pre-installed but to ensure that we can install extra packages for Node-RED we first need to install NPM, the Node Package Manager.
From the desktop open a terminal and enter the following command, at the end of the line press Enter
sudo apt update && sudo apt install npm
The install will take a few minutes so go and grab a drink, once completed we next need to install the Node packages for our DS18B20 sensor and for a GUI that will be used to display the output. To do this we need to first move into the hidden Node-RED directory and then run the commands. In the terminal type the following line by line and press Enter at the end of each line.
cd .node-red

npm i node-red-contrib-ds18b20

npm i node-red-dashboard
Installation will take a few moments but once completed control of the terminal will be returned to you. To launch Node-RED in the terminal type the following.
node-red-start /
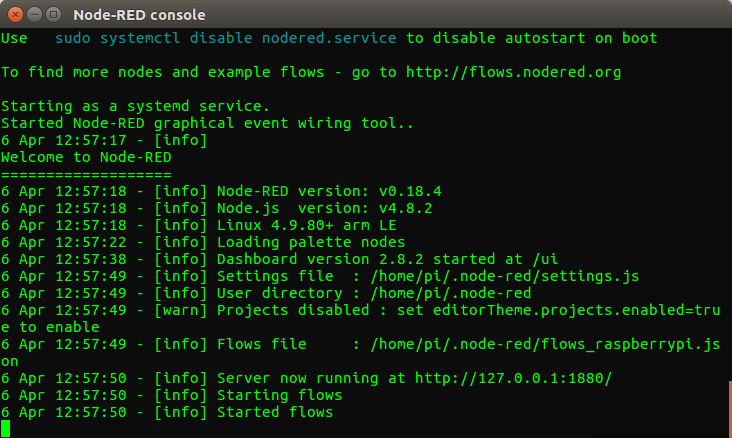
This will take a few seconds to load, but once ready you will see output in the terminal similar to this. You will see that we have a web address to open, http://127.0.0.1:1880 using this address with Chromium we can open the Node-RED interface.
The Interface is split into three sections, and from left to right they are.
The nodes: Where the nodes that make up or code are stored.
The flow: Where nodes are connected to form a flow, similar to an algorithm.
Info / Debug: This is where we can see information on nodes, and view the output of a node /flow.
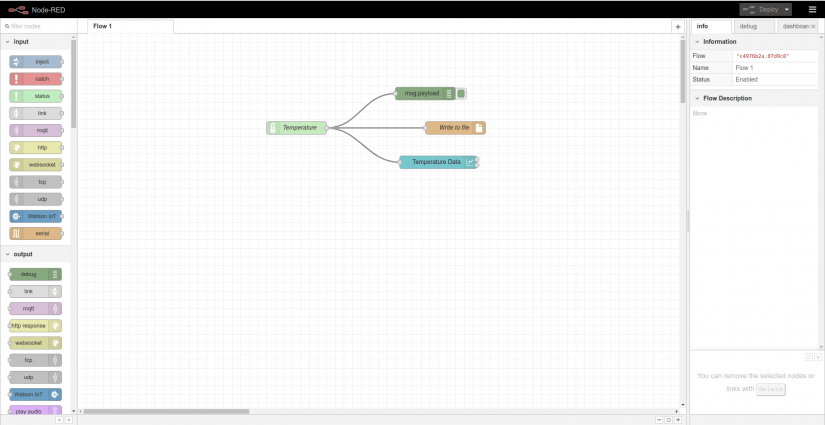
Let's start by dragging the DS18B20 node from the Raspberry Pi section of nodes to the centre flow area.
This is an input node, in that it provides input from our sensor. But first, we need to configure it. Double-click on the node and change the settings to match. The Sensor ID should only have one value generated by the system. Feel free to change the Interval time to suit your needs. But for testing purposes set it to 0.1, which is six seconds.

We next need to check that the sensor is sending data, and for this we need to use the debug node from the output group. Drag the debug node into the coding area and then look for the grey dot from the Temperature node, left click and hold then drag the “wire” from the Temperature node to the debug node. This means the output of the Temperature node will appear in the debug tab.

To run the check, click on Deploy and then change to the debug tab, you will see the sensor data appear as the temperature in Celsius.
Using the data to create a graph
Data is great but we need a way to easily consume and understand the data. Typically graphs are used to show trends in data such as currencies and temperature. So let's create a custom graph.
For this we need to headover to the dashboard tab and click on +tab to create a new tab that will contain the user interface. Call the tab “Dashboard”
Next click on +group to create a new layout for the interface, then click on edit and call the group “Temperature Data” then click on Update.
Now that we have our interface created, we next need to create the graph. For this scroll down to the dashboard nodes and look for chart drag this into the coding area and connect it to the temperature node in the same manner as we did for debug earlier.
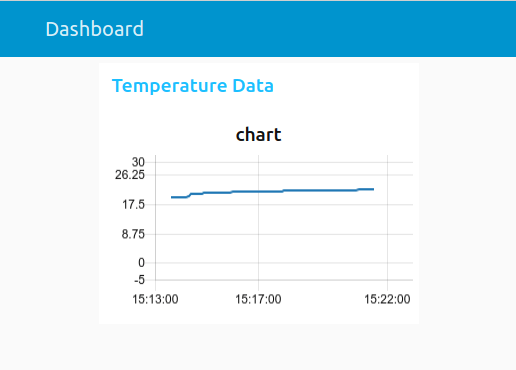
Double-click on the chart node to edit its properties. First add it to the Temperature Data [Dashboard] group, then change the label to “Temperature Data”. For the Y axis set the minimum temperature to -5 and the maximum to 30, of course alter this range to suit the temperatures in your part of the world, but in the UK it rarely gets above 30C. Lastly change the Name to “Temperature Graph” and click Done.
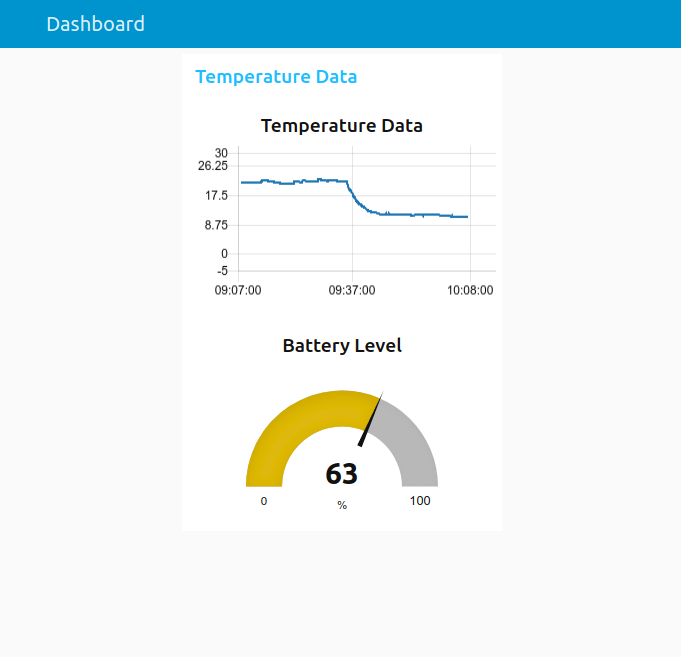
Let’s test the work that we have done so far. Click on Deploy to update the flow and write the changes. Now open a new tab and visit http://127.0.0.1:1880/ui to see the user interface and temperature graph.
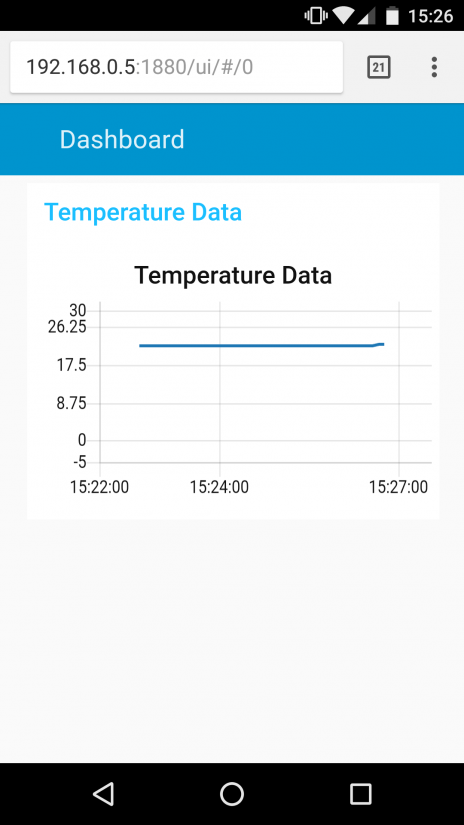
Remember we fixed the IP address earlier? Well handily that means we can also read the temperature from another device connected to the same network as our Pi Zero W. So while our Pi is out in the cold, we can be safely tucked up indoors and still check the temperature. On another device, such as a phone or tablet. Visit the IP address of the Pi, followed by the port and the location. For example, our Pi is on 192.168.0.5 so we need to visit 192.168.0.5:1880/ui to see the interface.
That’s it we have our own temperature sensor that will run off the grid and accumulate temperature data, plotted on to a graph for us to review from a mobile device. So now let's complete the final steps to make this project compete and one of those steps is to ensure that Node-RED runs on boot. And to do this we need to open a terminal on the Pi Zero W and run the following command.
sudo systemctl enable nodered.service
So now that Node-RED runs on boot, all we need to do now is place our equipment inside a waterproof, IP rated enclosure, but leave the DS18B20 outside, don’t worry it is waterproof! Connect the solar panel to the micro USB port of the Pi Juice, press SW1 to turn on the Pi Juice and Pi Zero W. Now go indoors and get a cuppa and watch the temperature data scroll across the screen of your mobile device!
Taking this further
This project illustrates how easy it is to deploy Pi Juice in the field to create a self-contained project. Pi Juice can accept many different power sources, as long as they use a micro USB connector, so we can use wind turbines, solar, water wheels, treadmill to top up the battery. Using Pi Juice with the Pi Zero W also means that we have a device that consumes a small amount of power and can provide data for a long, if not an indefinite period.
But how can we check our battery level from a mobile device?
Pi Juice has its own Python library, and we can use that library to check the status of the battery. So on the Raspberry Pi Zero W, open your favourite Python editor, and this is Python 2, not 3! Create a new file and enter the following code to create a script that will check the battery details and print them to the shell.
from pijuice import PiJuice, pijuice_hard_functions, pijuice_sys_functions, pijuice_user_functions

BUS = 1

ADDRESS = 0x14

pijuice = PiJuice(BUS, ADDRESS)

charge_level = pijuice.status.GetChargeLevel().get('data', -1)

print(charge_level)
Save the code as battery.py and make sure that it is saved in /home/pi/ and close the editor.
To run the code in Node-RED we need to modify our existing flow.
To run the code we need to use exec from the advanced nodes. This is an executable node that will run commands on the host operating system.
Edit the exec node as per this sequence.
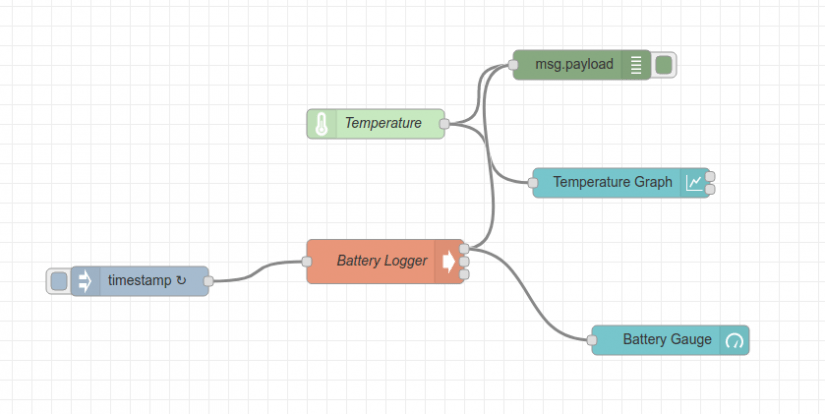
Now connect the stdout of the Battery Logger node to the msg.payload, debug node, this will enable us to see the battery stats in the debug tab.
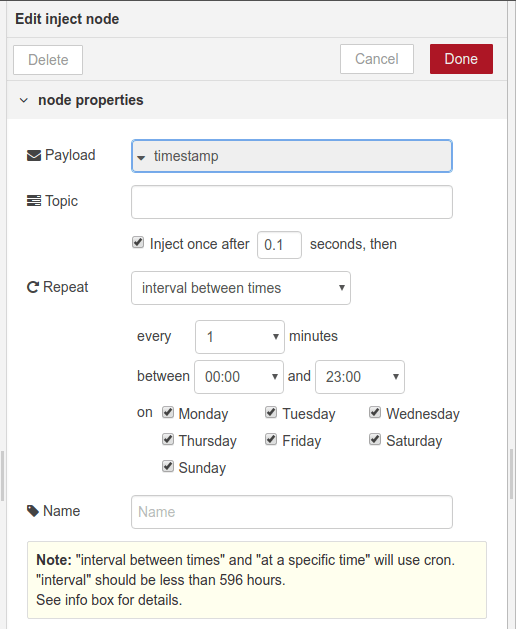
When ready click on Deploy to test the code. Take a look in the debug tab for the battery stats. Now we have a small issue; the stats show once then not at all! To keep the stats coming we need to use a trigger, in this case we use an inject node from the input section. Drag it in and connect it to the input of Battery Logger
Now edit the node so that it repeats every minute between 00:00 and 23:00 every day of the week.
Seeing the battery stats in the debug tab is ok, but we really need to see them in our app, and to do this we can use a gauge from the dashboard nodes. Drag this and connect it to the stdout of Battery Logger node.
Now let’s edit the Gauge node so that it displays the battery data. Edit the node as per these settings; any others can be left as default.
Group: Temperature Data [Dashboard]
Type: Gauge
Label: Battery Level
Units: %
Range: min 0 max 100
Name: Battery Gauge
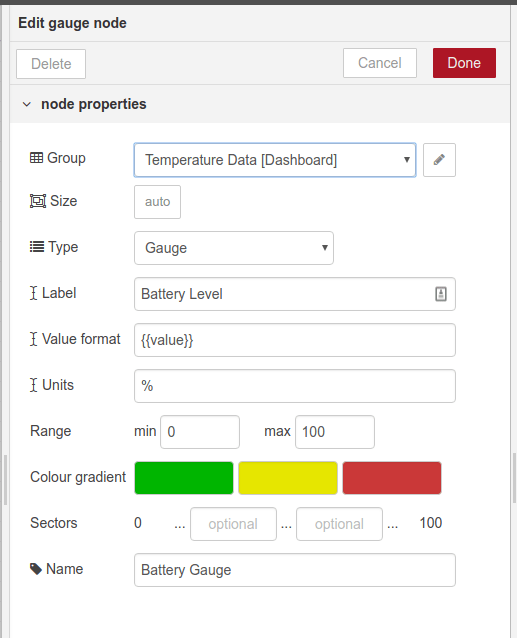
Click on Done and when ready click on Deploy to run the code. Now go back to your mobile device and refresh the app web page. You will see the new battery gauge appear and tell you the status of the battery.
So that’s it. Our Pi is off the grid and sending us data over WiFi, but this is just the start of your adventures!
What can you make with this project? Let us know on electromaker.io!

Les Pounder loves hacking and tinkering with Arduino, Raspberry Pi and new technologies. He passes on his skills and discoveries to Electromaker readers via tutorials and reviews.


Leave your feedback...