
Project Eel

Made by Ankur / 3D Printing / Environmental Sensing / Sustainability / Weather / IoT
About the project
Monitoring river water quality based on open-design multi-parameter sonde, built along with QuickFeather and SensiML service.
Project info
Difficulty: Moderate
Platforms: Adafruit, DFRobot, Raspberry Pi, SparkFun, TinyCircuits, Helium, SensiML, Seeed
Estimated time: 3 weeks
License: MIT license (MIT)
Items used in this project
Hardware components

View all
Software apps and online services
Story
Once water is contaminated, it is difficult, costly, and often impossible to remove the pollutants. Still today, 80 per cent of global wastewater goes untreated, containing everything from human waste to highly toxic industrial discharges. In addition, pollution of freshwater ecosystems impacts the habitat and quality of aquatic & geo-logical life cycle.
Marine pollution, 1st theme of the 2017 #OurOcean conferenceA 2016 preliminary assessment of the water quality situation in rivers in Latin America, Africa and Asia, A Snapshot of the World’s Water Quality, estimates that severe pathogenic pollution affects around one third of all rivers, severe organic pollution around one seventh of all rivers, and severe and moderate salinity pollution around one-tenth of all rivers in these regions.
rapid onset of Algal booms.

rapid onset of Algal booms.
Increase in water temperature can result in the death of many aquatic organisms and disrupt many marine habitats. For example, a rise in water temperatures causes coral bleaching of reefs around the world. Increase in Eutrophication-levels that are further responsible for harmful algal-booms (HAB), which impact local wildlife and viability of the water, leading to anoxic conditions and so-called “dead zones.”
Proposed SolutionThe challenge is to utilize low-cost instrumentation, IoT and Edge Analytics and provide meaningful insights in order to create awareness among community regarding the problem-statement.
While there exists numerous ready-made solutions for monitoring water quality from tech companies likes Xylem-Analytics, OTT-HydroMet, Libelium, and others. But, owing to their associated costs, these measurement instruments are widely used by research companies, universities and institutes. On the other hand, platforms like PublicLab and the Cave Pearl Project readily fulfill the demands of developing open-source technology categorized under CitizenScience.
Project EEL comprises of three sub-systems:
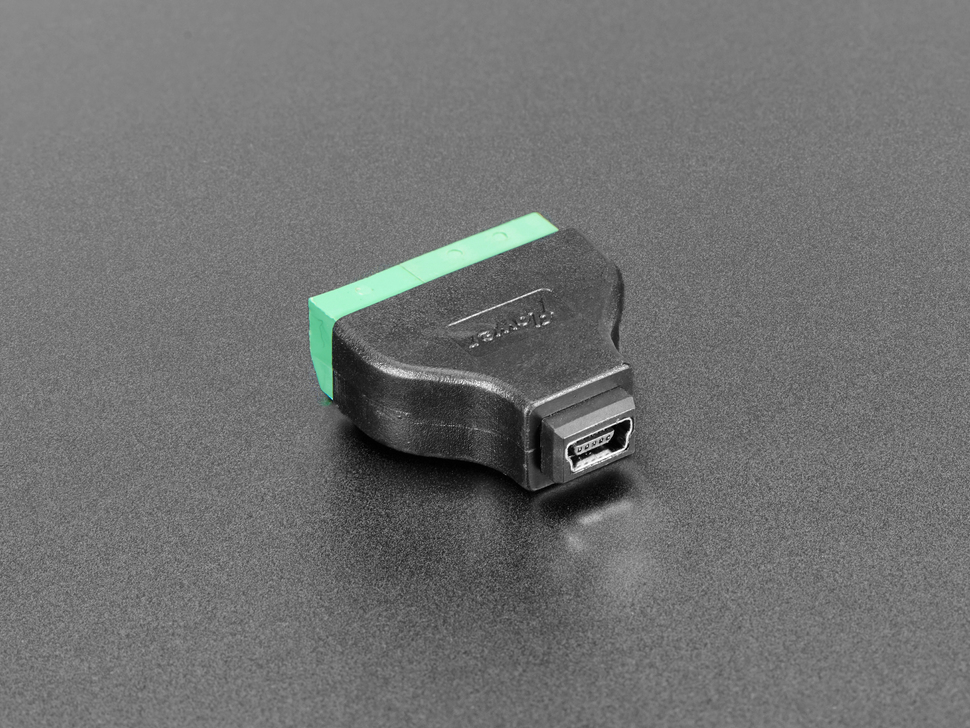
1) Open-design Sonde, which consists of multi-parameter sensors for measuring water-quality like: Conductivity, Turbidity, TDS, Temperature, Hydrophone, Colorimeter and water-flow state that are measured over ATtiny3217 and combined with edge-analysis via QuickFeather board. The entire hardware ecosystem is mounted within waterproof enclosure and powered over cable from the Base unit.
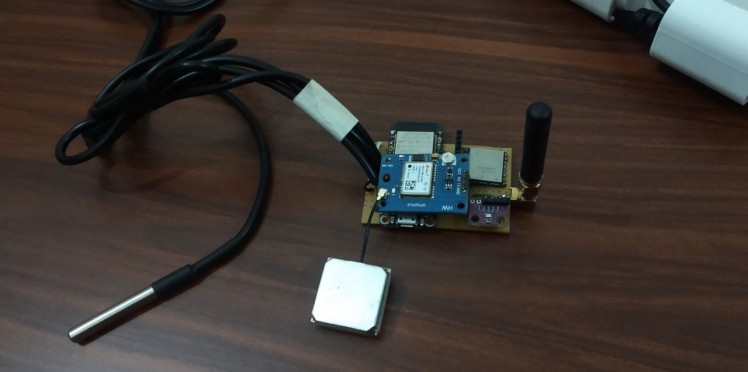
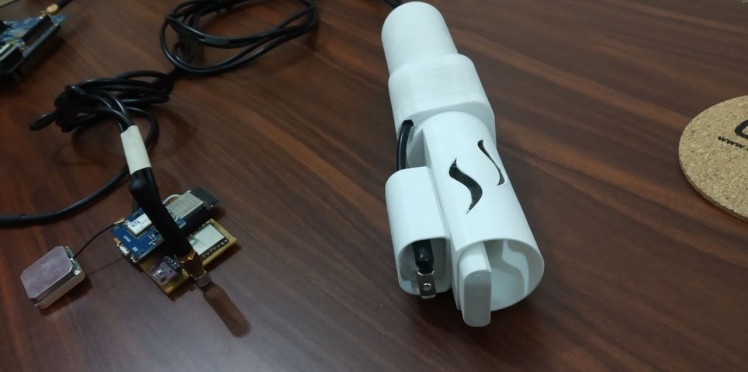
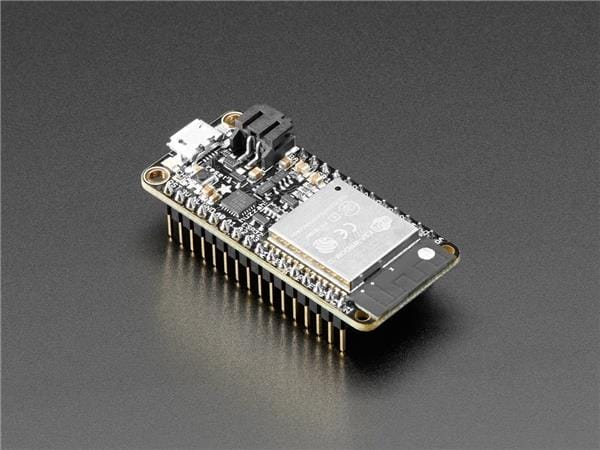
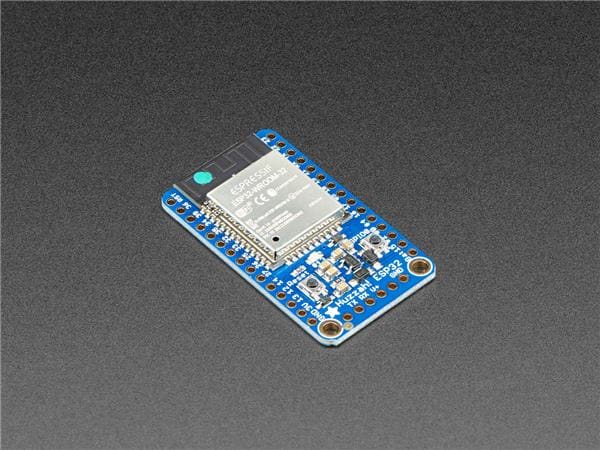
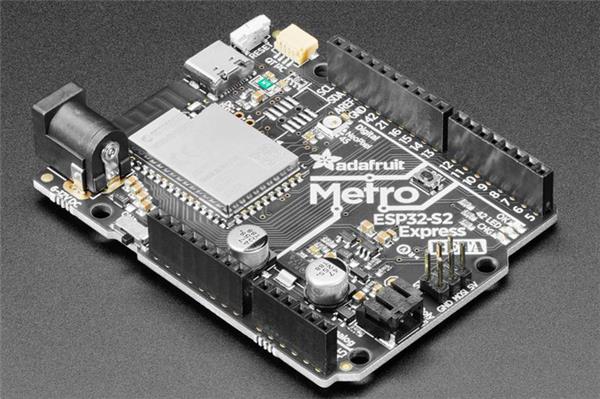
2) Sense & Acquisition Base Unit, consists of Huzzah32 and LoRa platform for getting data from submerged Sonde and combines them with GPS, Ambient environment and Surface water temperature parameters.
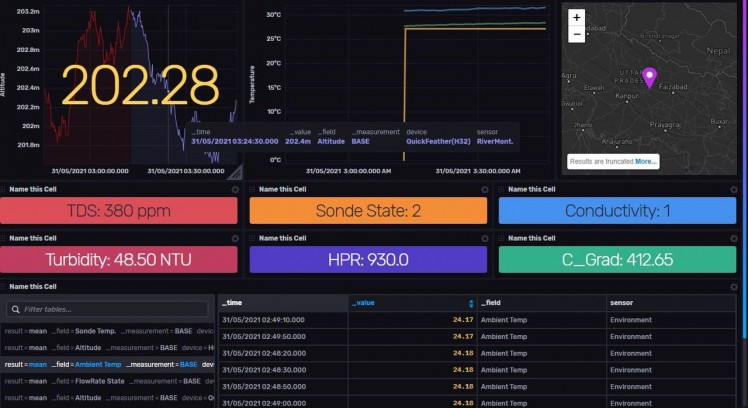
3) Gateway, is based on RPi ZW that fetches the data over LoRa network and pushes data into time-series InfluxDB cloud service for end visualization and alerts.
Project EEL main dashboard

Project EEL main dashboard
Features
- Design of Base unit could be easily adapted for standalone and floating configuration, that can be powered over photovoltaics, alongside ambient temperature and relative altitude measurement done over BMP280 sensor. It further integrates Ublox Neo-6M GPS for location monitoring and timestamping alongside waterproof DS18b20 temperature probe for getting surface water temperature and is correlated with Sonde's temperature probe.
- Colorimeter within the Sonde can be utilized to get optical characteristics of surrounding water column in range of visible and UV spectrum, simulated with WS2812b and UV-B LED. For our scope, it was enough to provide calibrated ADC values off the photodiode. Owing to the use case, it can be replaced with spectrophotometer sensor from Hamamatsu for better results like classification of blue-green algae, determining mineral signatures, etc.
An overview of QuickFeather & SensiML:
1 / 2


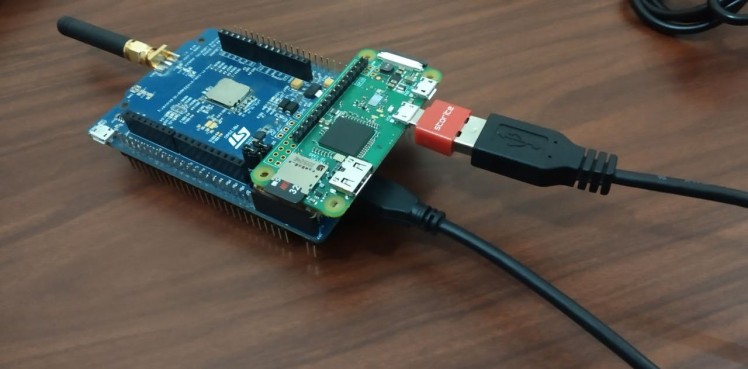
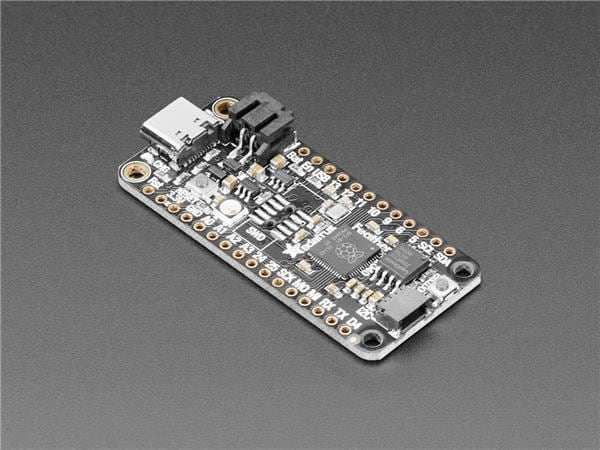
QuickFeather is powered by QuickLogic’s EOS™ S3, an FPGA-enabled Arm Cortex®-M4F MCU, fully supported within Zephyr RTOS, and consists onboard accelerometer, pressure sensor, microphone and 16-Mbit of flash memory with support for Symbiflow and SensiML software suite.
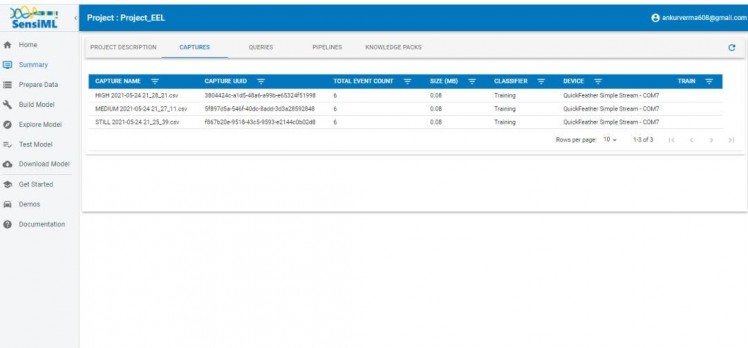
SensiML on the other end offers myriad products like Data Capture Lab, state-of-the-art Analytics Studio, Open Gateway, TestApp(with support for Windows & Android) and easy integration of TFLite.
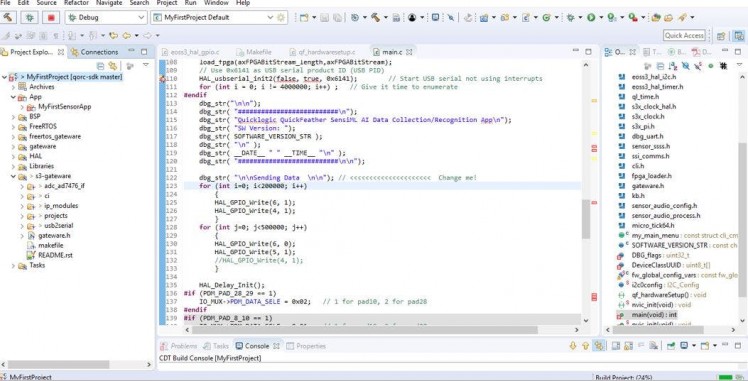
Testing the PoCDuring the project completion numerous challenges were encountered regarding programming QF from SDK, integration of external sensors (!I2C), implementing custom firmware, data analysis & integration of knowledgepacks. Kudos, to our contest-organizers that supported our development through interactive ‘serial’ webinar sessions and hardware support-tickets.
For our test-purpose, we utilized simple-stream binary provided by SensiML, that helped to understand the SensiML DCL & Analytics Studio platform. Thanks to Arduino“having11”Guy introductory tutorial.
1 / 12


Initial tests as always
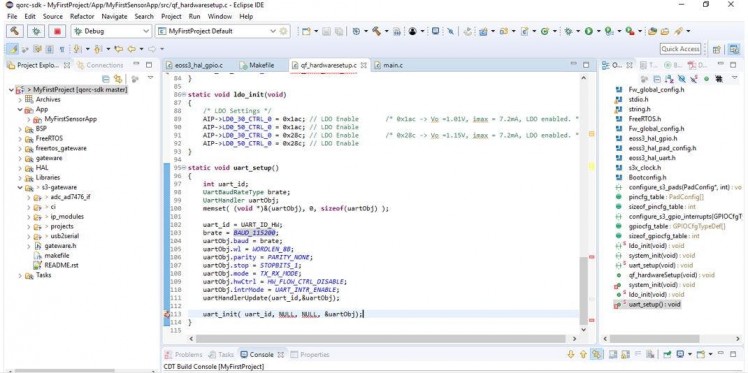
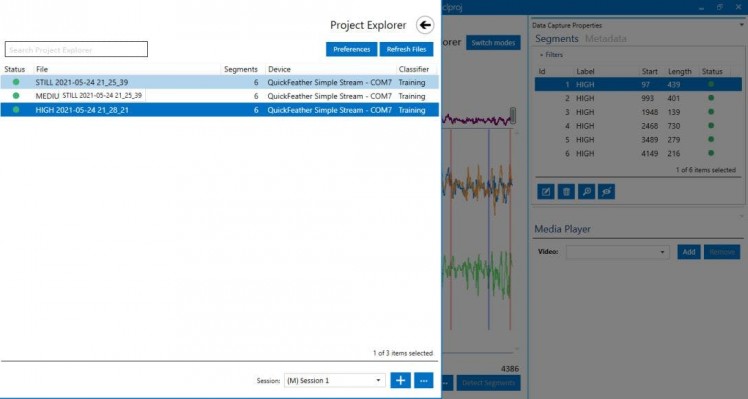
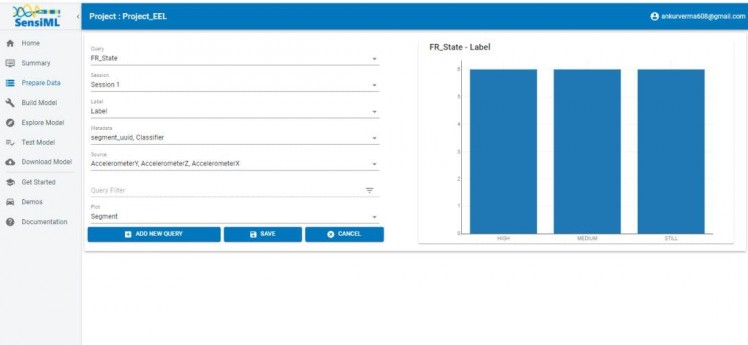
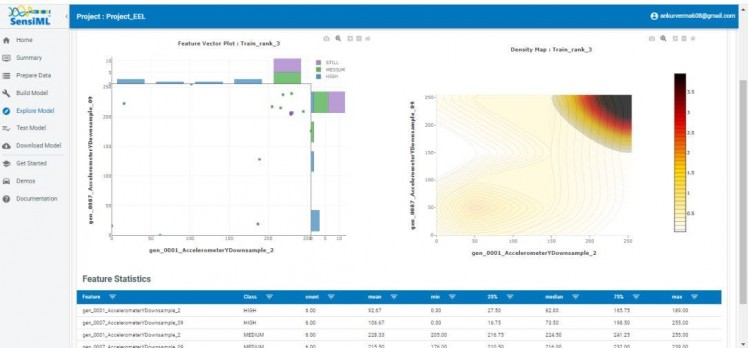
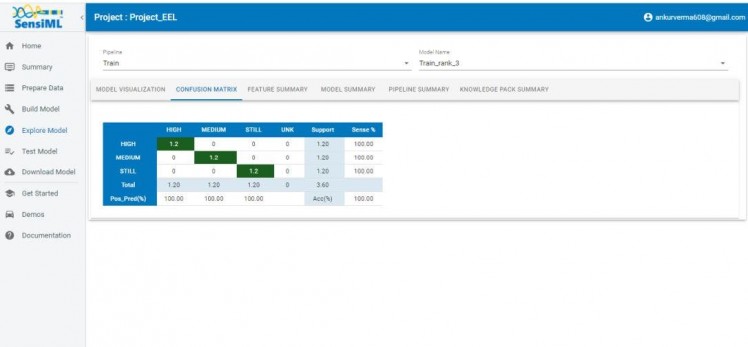
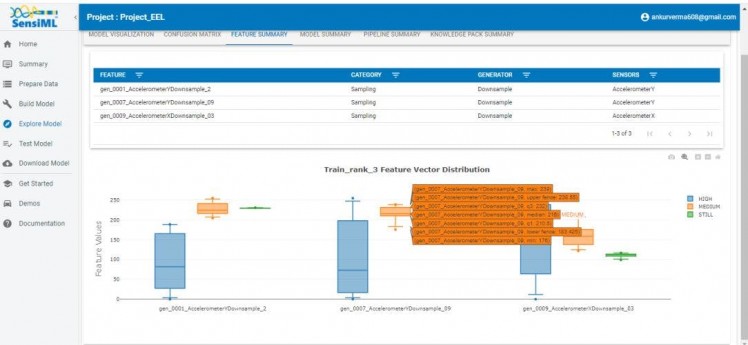
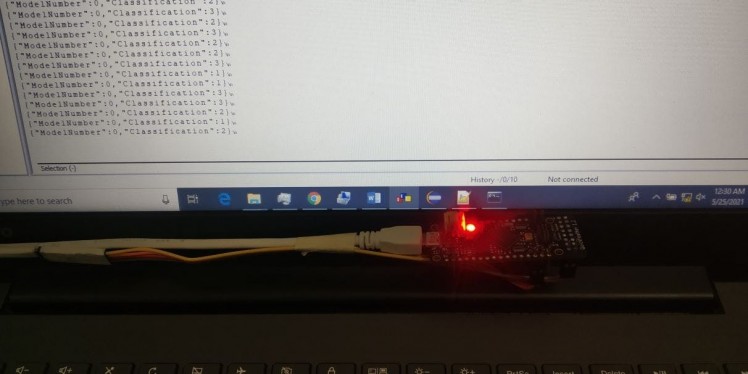
Using the on-board accelerometer sensor on QF board, water flow state [F.R. State] was determined as per three class labels: STILL, MEDIUM and HIGH. Minor modifications were done with provided qf_ss_ai_app source code like reducing the baud-rate from 460800 to 115200 and the main() initializing sequence, afterwards the classification data from QF was captured over UART of ATtiny and packetized into string, that is further transmitted over UART to Huzzah32 board.
1 / 3 • Testing Classification results

Testing Classification results

Packetizing sensor values with classification state

RPi0W logs obtained over LoRa network
Building & Designing the Hardware
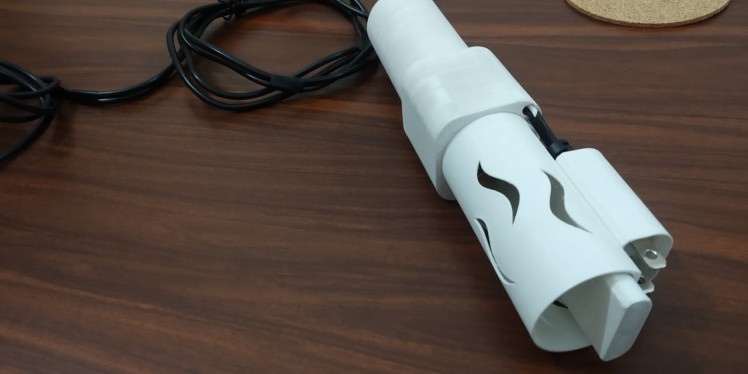
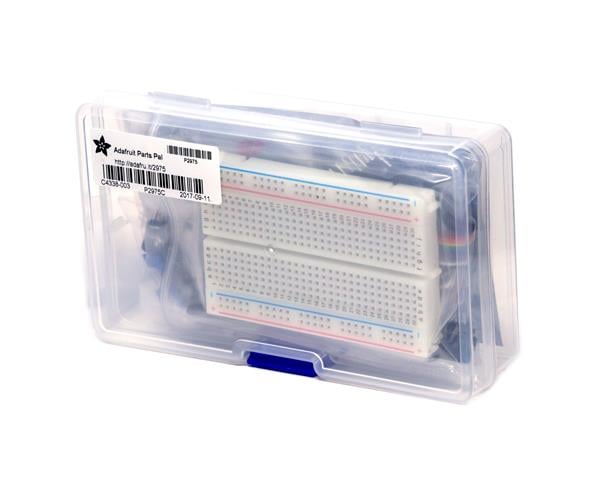
After testing the initial concept & completing sonde enclosure design. The parts were 3D printed on our regular printer and heavy amounts of glue, clear varnish and silicone sealant was used for mounting and sealing the sensors once and for all.
1 / 5 • Almost Final.

Almost Final.

Initial Base Unit design based on ATtiny3217

rough rendering of Sonde.

required parts that can be printed/machined/manufactured
")
Printing sub-assemblies at a time.(saves lot)
Assembling & Testing the Sonde
1 / 10 • Sonde sensing-node cluster featuring Colorimeter, Turbidity sensor, Hydrophone unit & EC/TDS unit.

Sonde sensing-node cluster featuring Colorimeter, Turbidity sensor, Hydrophone unit & EC/TDS unit.

Piezo Hydrophone mount.

Hydrophone and EC/TDS unit.

Turbidity sensor mounting within the cuvette coupler.
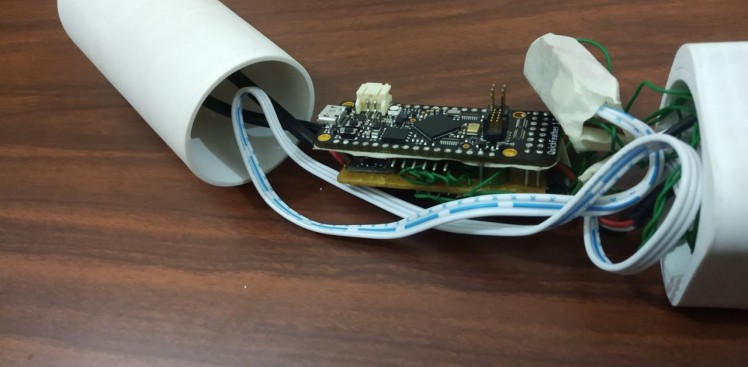

Pre-checking the hardware and sensors.
")
messing with wires(already)

Post-check with entire hardware.

Finally completed.
While, some units like EC & TDS were calibrated as per standard NaCl buffer solution in different concentration, excluding the turbidity sensor (due to lack of standard Formazin solution at the moment), and hence was programmed as per given Nephelometric equation curve obtained from the dfRobot's webpage.
Overall, the entire build worked as expected, but still needs to be verified by standard laboratory grade instruments.
Pushing data to InfluxDB CloudInfluxDB provided numerous ways of data ingestion & integration with it's client libraries support for arduino, scala, kotlin, python, swift, C#, etc. and numerous telegraf plugins that can be further linked to grafana data visualization platform. In the free-tier one can get max. of two buckets for data storage, a month of data retention along with slack notification for prototyping our PoC.
1 / 3

Fetching Sonde & Base parameters

Setting FlowRate Alert Thresholds
Conclusion: Quickfeather and SensiML platform possess huge possibilities for true intelligent-edge-computing. Personally, learnt a lot during the entire project completion and would continue to expand on our project with more sensor-integration like DO, pH and water current direction estimation using magnetometer.
Further, getting onboard pressure, accel and microphone as single collection and classification instance still proves to be a personal challenge aka hardware-nightmare.
Muxing low cost hardware and Open-source architecture along with machine-learning will continue to be the next big trend in the field of IoT.
Schematics, diagrams and documents
CAD, enclosures and custom parts
Code
Credits
Related products


Leave your feedback...