
Predicting The F1 Champion With Tinyml

Made by leonardo-leo / Artificial intelligence / Automotive / Displays / Games & Gaming / IoT
About the project
Collecting and analyzing data to predict which F1 car will finish the race first.
Project info
Difficulty: Moderate
Platforms: Arduino, Microsoft, PlatformIO, Neuton Tiny ML
Estimated time: 7 days
License: GNU General Public License, version 3 or later (GPL3+)
Items used in this project

Software apps and online services
Story
- Platformio is a collaborative platform for embedded software development that supports a lot of boards of different vendors. It has a user-friendly interface with code completion and an integrated debugger.
- Neuton Platform enables the fast and seamless creation of optimal models, offering a high level of automation in data processing and neural network pipeline generation.
Hardware Components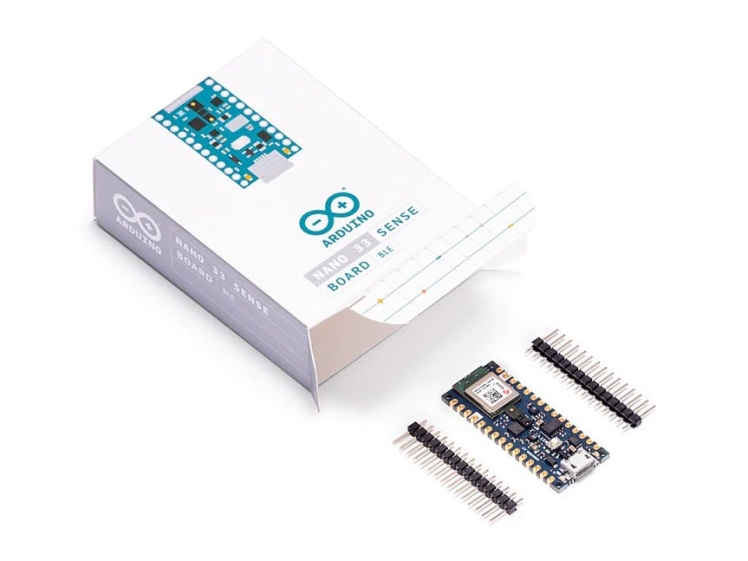
I've always been fascinated by Formula One and how fast cars race around the track. Since my other big interest is experimenting with machine learning, I came up with an idea to combine these two passions and create a project dedicated to vehicle speed prediction.
Of course, I don't have the opportunity to conduct such experiments on a real track and with real racing cars, so I decided to predict which F1 car is faster based on accelerometer and gyroscope sensors fixed on a miniature F1 car!
Arduino Nano 33 BLE Sense in a F1 miniature car

Arduino Nano 33 BLE Sense in a F1 miniature car
This is a simplified example of what tiny machine learning can do in motorsport. But since F1 utilizes innovative technologies, I believe the approach described in this article can be scaled to make predictions and help real teams in the world championships.
ProceduresMy experiment includes the following three steps:
- Collecting the data for a dataset
- Training a TinyML model
- Deploying the model on a microcontroller
Next, I will describe all three stages of the experiment in more detail so that you have the opportunity to repeat them.
Collecting the data
To create a good dataset, I perform measurements by placing an MCU on a car and moving it at a different speed. The firmware makes readings on the accelerometer and gyroscope sensors to collect the data. It reads 2 seconds of data and calculates the statistics of those readings values. After that, it prints the statistics in CSV format to upload to the Neuton platform.
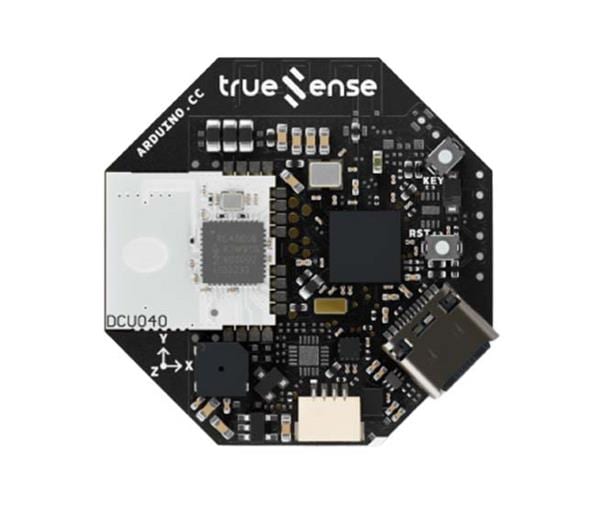
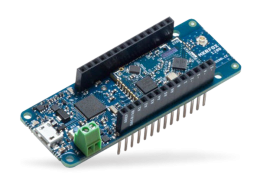
As the first step, you need to upload the firmware to Arduino Nano 33 BLE Sense. It comes with a series of embedded sensors:
- 9 axis inertial sensor (I used it to detect the car movement behavior)
- humidity and temperature sensor
- barometric sensor
- microphone
- gesture, proximity, light color, and light intensity sensor
Find the repository with the complete code here: https://github.com/leoribg/neuton-f1-data-collect.
Secondly, you need to make the movements for each target you want to identify.
My targets:
0: Car Idle (Car is stopped)
1: Ferrari F1 Car (Speedy)
2: HAAS F1 Car (Kinda fast)
3: Williams F1 Car (Slow)
Here is the output:
srcmain.cpp
Demo Statistics lib 1.0.0
Accelerometer sample rate = 119.00 Hz

Acceleration in G's
X	Y	Z
Gyroscope sample rate = 119.00 Hz

Gyroscope in degrees/second
X	Y	Z
aXmin,aXmax,aXavg,aXvar,aXstdev,aXunbiasStdDev,aYmin,aYmax,aYavg,aYvar,aYstdev,aYunbiasStdDev,aZmin,aZmax,aZavg,aZvar,aZstdev,aZunbiasStdDev,gXmin,gXmax,gXavg,gXvar,gXstdev,gXunbiasStdDev,gYmin,gYmax,gYavg,gYvar,gYstdev,gYunbiasStdDev,gZmin,gZmax,gZavg,gZvar,gZstdev,gZunbiasStdDev,target
0.04,0.17,0.05,0.00,0.01,0.01,-0.03,0.01,0.01,0.00,0.00,0.00,0.89,1.43,0.96,0.00,0.03,0.03,-0.79,225.10,0.96,232.62,15.25,15.28,-100.34,1.22,0.35,47.32,6.88,6.89,-13.37,-0.24,-0.53,0.85,0.92,0.92,3
0.05,0.05,0.05,0.00,0.00,0.00,0.01,0.01,0.01,0.00,0.00,0.00,0.96,0.97,0.97,0.00,0.00,0.00,-0.85,-0.12,-0.44,0.01,0.12,0.12,0.85,1.28,1.08,0.01,0.09,0.09,-0.61,-0.18,-0.41,0.00,0.07,0.07,3
Now, you have to copy the output and save it as a CSV file for all targets.
Training the model
Upon the dataset collection, you are ready to train your model. For that purpose, I used the Neuton platform, as it’s free.
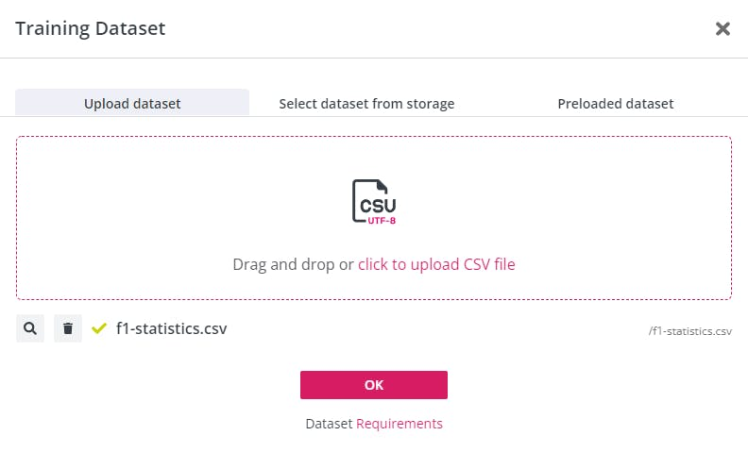
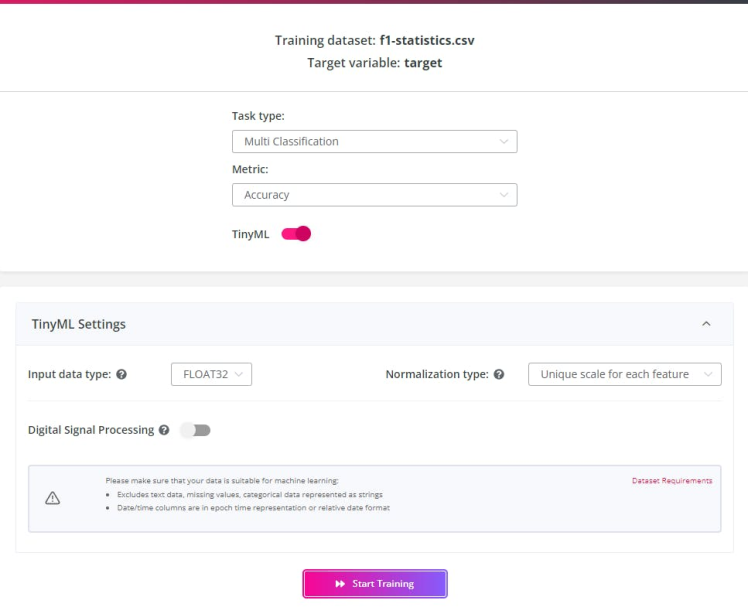
Upload your dataset in a CSV format and click OK.
Select the target variable and click "Next".
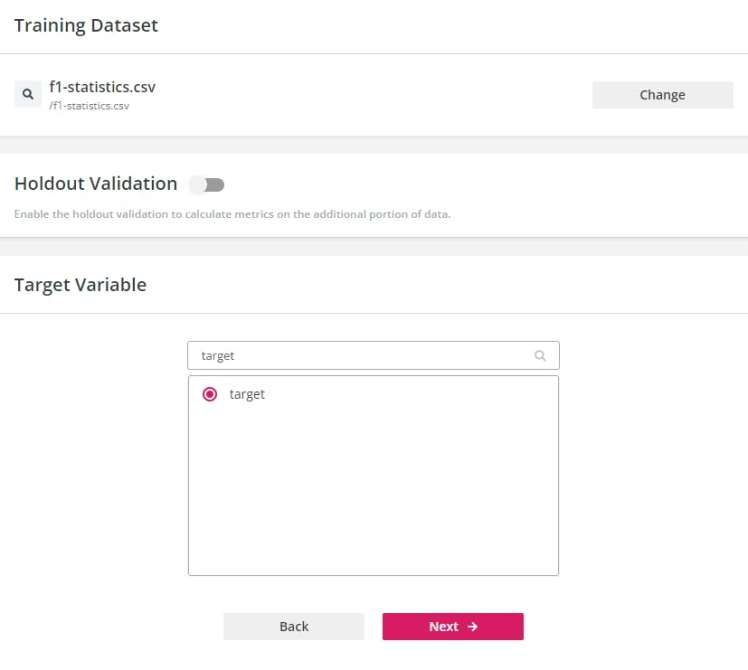
This project detects one of four possible targets, so it is a multiclassification problem. Neuton can automatically detect a task type based on the target variable values. You need to select the best metric to represent the model quality, for this type of problem, I selected “Accuracy” and also enabled the TinyML mode.
Click “Start Training” and relax until the model training is complete.
One more cool thing about Neuton is that the platform makes it possible to evaluate the quality of the trained models. You can check the meaning of each metric here: https://lab.neuton.ai/#/support_library/metrics/.
Here is the model that I got:
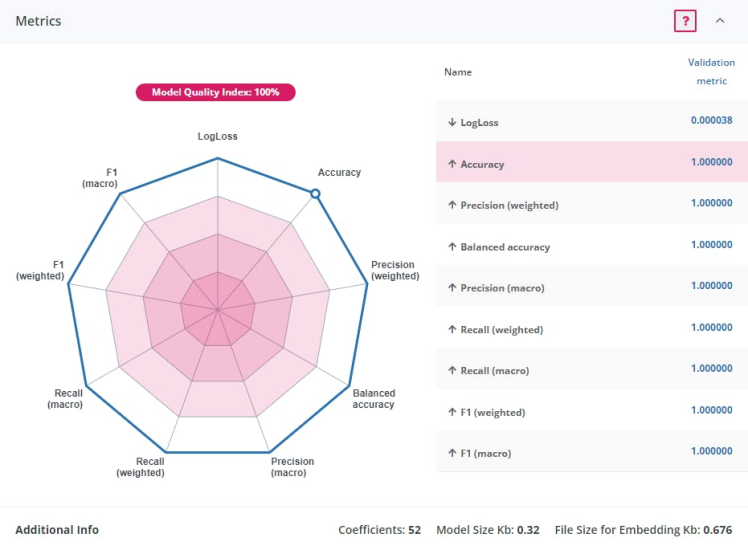
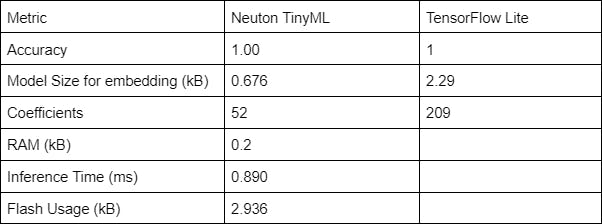
I got 100% model accuracy, but I was curious about whether I got the smallest size of the model. To check this, I decided to build the model on TensorFlow Light. Actually, I asked a friend to help me, as it requires special coding skills and time, but after a day of work, I realized that my first model, which was automatically created with Neuton, was 4 times smaller. I decided not to embed the TFL model, but I am sharing with you the comparison of metrics.
Deploying on a microcontroller
Neuton automatically generates the C library after clicking on the “Download” button.
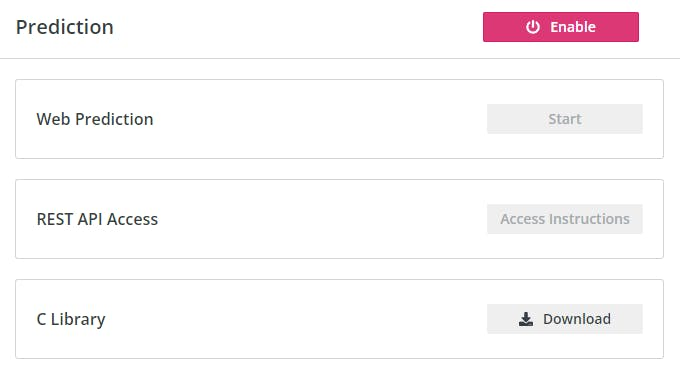
Once the library is downloaded, It’s time to run the inference on a microcontroller.
You need to set the input for your model with the same format you have trained it.
typedef struct
{
float aXmin; // minimum acceleration in X axis
float aXmax; // maximum acceleration in X axis
float aXavg; // average acceleration in X axis
float aXvar; // variance of acceleration in X axis
float aXstdev; // standard deviation of acceleration in X axis
float aXunbiasStdDev; // unbias standard deviation of acceleration in X axis
float aYmin; // minimum acceleration in Y axis
float aYmax; // maximum acceleration in Y axis
float aYavg; // average acceleration in Y axis
float aYvar; // variance of acceleration in Y axis
float aYstdev; // standard deviation of acceleration in Y axis
float aYunbiasStdDev; // unbias standard deviation of acceleration in Y axis
float aZmin; // minimum acceleration in Z axis
float aZmax; // maximum acceleration in Z axis
float aZavg; // average acceleration in Z axis
float aZvar; // variance of acceleration in Z axis
float aZstdev; // standard deviation of acceleration in Z axis
float aZunbiasStdDev; // unbias standard deviation of acceleration in Z axis
float gXmin; // minimum gyroscope in X axis
float gXmax; // maximum gyroscope in X axis
float gXavg; // average gyroscope in X axis
float gXvar; // variance of gyroscope in X axis
float gXstdev; // standard deviation of gyroscope in X axis
float gXunbiasStdDev; // unbias standard deviation of gyroscope in X axis
float gYmin; // minimum gyroscope in Y axis
float gYmax; // maximum gyroscope in Y axis
float gYavg; // average gyroscope in Y axis
float gYvar; // variance of gyroscope in Y axis
float gYstdev; // standard deviation of gyroscope in Y axis
float gYunbiasStdDev; // unbias standard deviation of gyroscope in Y axis
float gZmin; // minimum gyroscope in Z axis
float gZmax; // maximum gyroscope in Z axis
float gZavg; // average gyroscope in Z axis
float gZvar; // variance of gyroscope in Z axis
float gZstdev; // standard deviation of gyroscope in Z axis
float gZunbiasStdDev; // unbias standard deviation of gyroscope in Z axis
} stats_t;

stats_t stats;
And run the inference based on the input data.
if (neuton_model_set_inputs((input_t *)&stats) == 0)
{
uint16_t predictedClass;
float *probabilities;
if (neuton_model_run_inference(&predictedClass, &probabilities) == 0)
{
// code for handling prediction result
Serial.print("Predicted CAR: ");
switch (predictedClass)
{
case TARGET_IDLE:
Serial.println("IDLE");
Serial.print("Probability: ");
Serial.println(probabilities[0]);
break;
case TARGET_FERRARI:
Serial.println("FERRARI F1 CAR! P1!");
Serial.print("Probability: ");
Serial.println(probabilities[1]);
break;
case TARGET_HAAS:
Serial.println("HAAS CAR! P12!");
Serial.print("Probability: ");
Serial.println(probabilities[2]);
break;
case TARGET_WILLIAMS:
Serial.println("WILLIAMS CAR! P19!");
Serial.print("Probability: ");
Serial.println(probabilities[3]);
break;
default:
Serial.println("UNKNOWN");
break;
}
}
}
All the code necessary to run this model is available here: https://github.com/leoribg/neuton-f1-model.
Testing your modelConnect your board to a PC with a USB cable and connect it to serial monitor software, like Putty, Docklight, or TeraTerm, to check the inference results.
Formula One is a competition among the best drivers in the world, but also is a battle between the engineers. During a Grand Prix, every car is equipped with hundreds of sensors generating massive quantities of real-time data. This data can be combined with historical data to train machine learning models to help the teams make the best decisions and predictions.
As this sport embraces new technologies, I’m convinced that machine learning has great potential for use by F1 engineering teams, giving them new insights into racing and car development. Plus, implementing such solutions is really quick and easy (I proved it in my project!). I hope my tutorial will inspire you to repeat this experiment or create your own TinyML projects!
CAD, enclosures and custom parts
Code
Credits
leonardo-leo
Master Degree Engineer at Federal University of Itajubá - Brazil / Telecommunications Engineer graduated at Inatel - Minas Gerais - Brazil
Related products


Leave your feedback...