
Irrigation Level Assessment By Thermal Imaging W/ Tensorflow

Made by kutluhan_aktar / 3D Printing / Artificial intelligence / Garden / Plants / IoT
About the project
Collect irrigation level data by thermal imaging, build and train a neural network model, and run the model directly on Wio Terminal.
Project info
Difficulty: Expert
Platforms: Microsoft, Raspberry Pi, Seeed Studio, Python, TensorFlow, Seeed
Estimated time: 4 weeks
License: Creative Commons Attribution CC BY version 4.0 or later (CC BY 4+)
Items used in this project
Hardware components

Software apps and online services
Story
Since global temperatures are expected to rise over the next few decades due to climate change and thus evaporation rates will increase, water scarcity and the expansion of arid regions threaten productive agricultural areas and long-term water availability. Considering water availability is already limited, we need to desist from profligate water utilization in agriculture to sustain our meager water resources. Otherwise, we will encounter more critical predicaments than depleting arable lands due to water scarcity and deficiency.
Since there is already an imbalance between the irrigation demand and the available water resources[1], it is crucial to avoid poor irrigation timing and insufficient or extravagant applications of water, which are unfortunately rife in agriculture. To sustain irrigated agriculture and maximize the quality of the product and the estimated crop yield while optimizing the quantity of water used per unit area[2], we need to apply precise irrigation scheduling methods. In that regard, we can improve water use efficiency and agricultural water management while preserving water and increasing the profitability of agroecosystems.
After perusing recent research papers on irrigation management, monitoring, and scheduling, I decided to create an easy-to-use and budget-friendly device to monitor plant water status (irrigation levels) by thermal imaging in the hope of making irrigation scheduling accessible even for hobbyists. As opposed to classical measurement devices and methods for monitoring plant water status (irrigation levels), thermal imaging is a non-invasive, non-contact, and non-destructive technique. Also, thermal imaging allows us to elicit measurements of water status (irrigation levels) directly from plants without employing labor demanding and time-consuming processes. As explained below, thermal imaging is emerging as a ubiquitous method to detect plant water status (irrigation levels) due to its precision and accessibility.
Infrared thermography (thermal imaging) for monitoring plant water status (irrigation levels) is a technique based on the relationship between leaves' (or crop canopy) stomatal closure or aperture and their surface temperature. When leaves (or crop canopy) transpires, they lose water through their stomata, and therefore the crop canopy temperature decreases. However, once plants go into water stress, their stomata begin to close and cease to transpire, causing the plant to heat up and the crop canopy temperature to rise. Also, the crop canopy temperature is correlated with specific plant physiological parameters, such as stomatal conductance. In addition, thermal imaging appears to have potential advantages over gas-exchange measurement when monitoring stomatal responses in phenotyping plant studies[3].
Even though thermal imaging is a technique with high precision and advantages, it is still struggling to interpret and analyze thermal imaging data to extrapolate and assess irrigation levels without applying algorithms. Hence, I decided to build and train an artificial neural network model to detect irrigation levels by thermal imaging automatically.
To collate thermal imaging data and create a data set easily, I developed a web application in PHP before building and testing my neural network model. Then, to make irrigation scheduling and monitoring by thermal imaging as accessible as possible, I utilized a Wio Terminal and an MLX90641 thermal imaging camera to collect thermal imaging data and run my neural network model after training it.
After completing my data set, I built my artificial neural network model (ANN) with TensorFlow to make predictions on the irrigation classes (labels) based on thermal imaging. Empirically, I assigned an irrigation class (label) for each thermal imaging array (input) generated by the MLX90641 thermal imaging camera:
- Dry
- Moderate
- Sufficient
- Excessive
After training and testing my neural network model, I converted it from a TensorFlow Keras H5 model to a C array (.h file) to execute the model on the Wio Terminal. Since the thermal imaging camera is directly connected to the Wio Terminal, the device is capable of detecting irrigation levels (classes) in the field effortlessly.
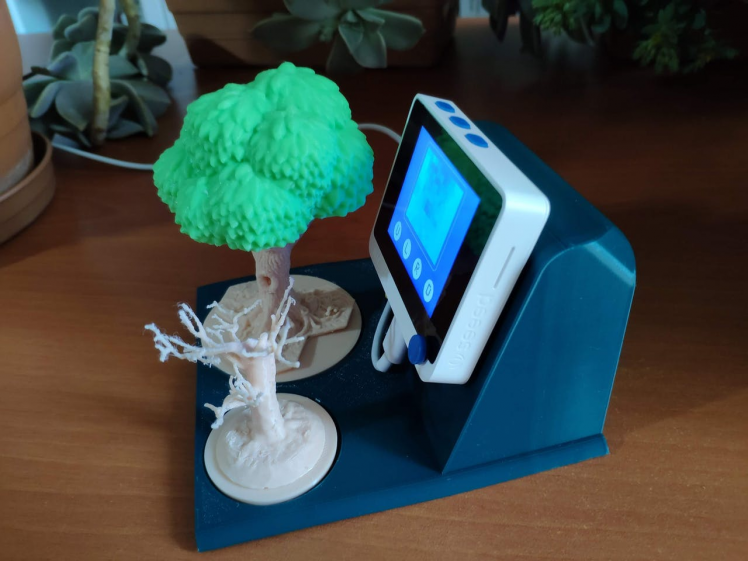
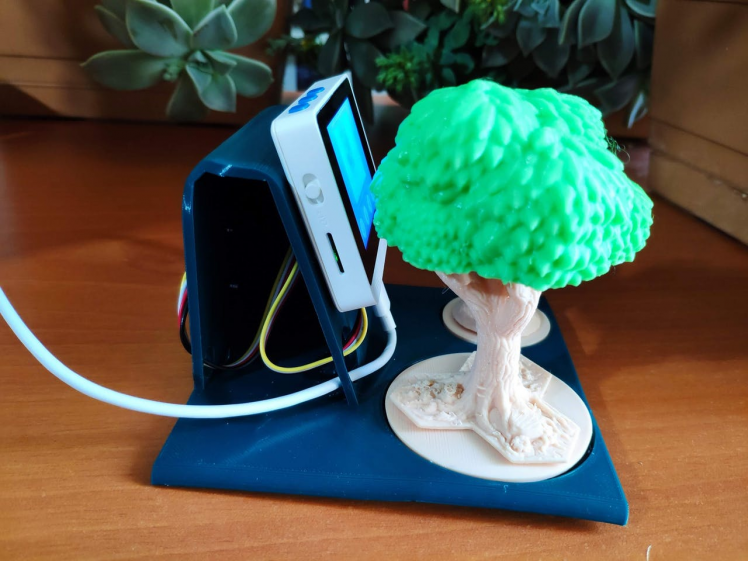
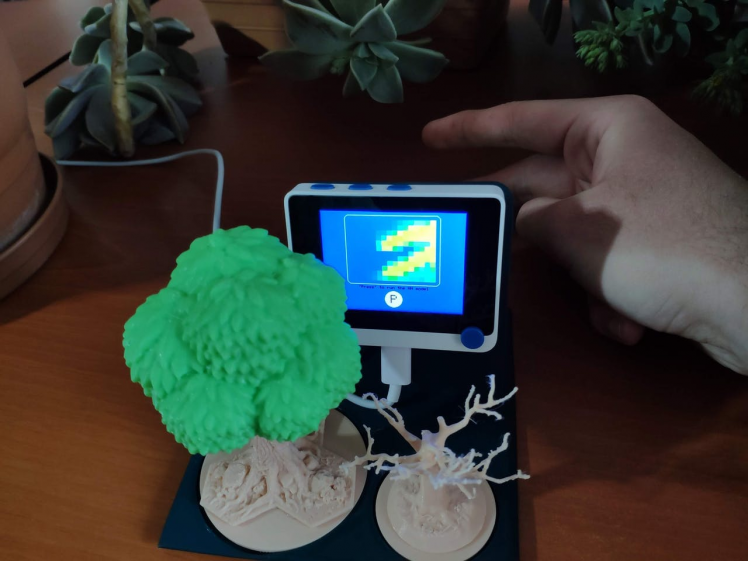
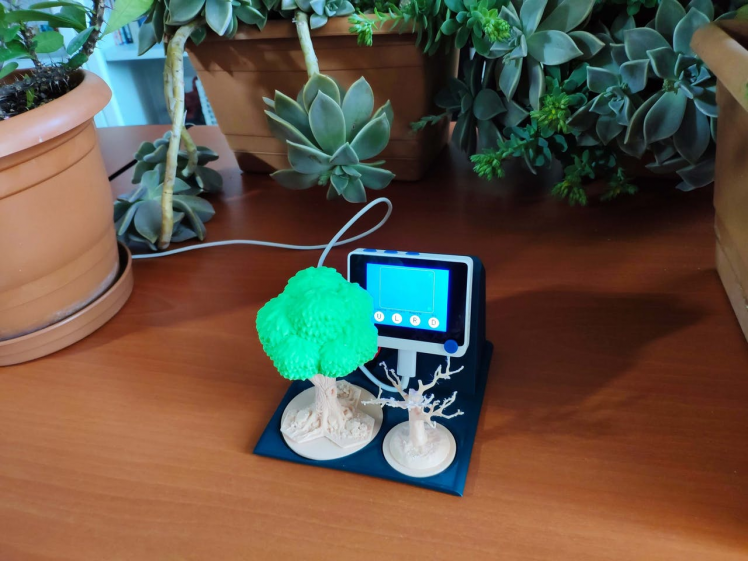
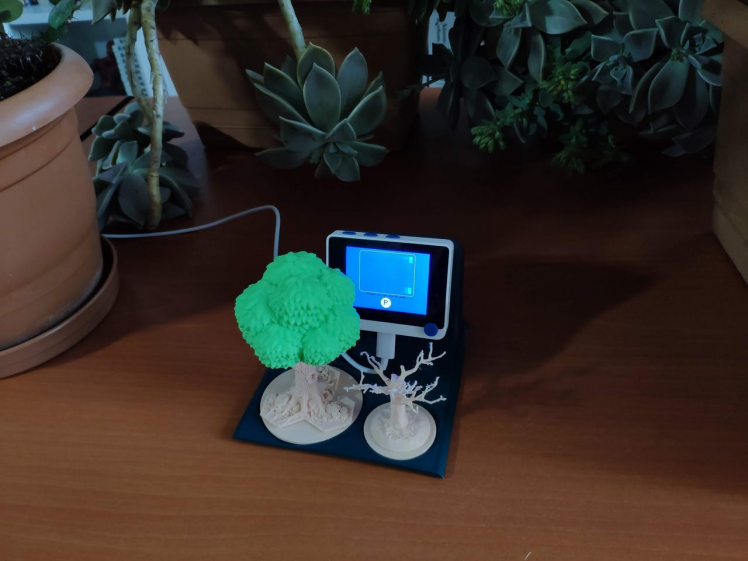
Lastly, to make the device as compact and robust as possible, I designed a forest-themed case (3D printable).
So, this is my project in a nutshell ?
In the following steps, you can find more detailed information on coding, data collection, building an artificial neural network model with TensorFlow, and running it on Wio Terminal.
Huge thanks to Seeed Studio for sponsoring these products:
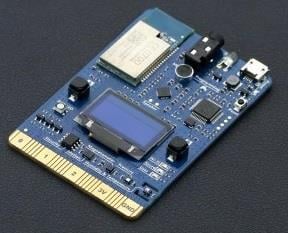
⭐ Wio Terminal | Inspect
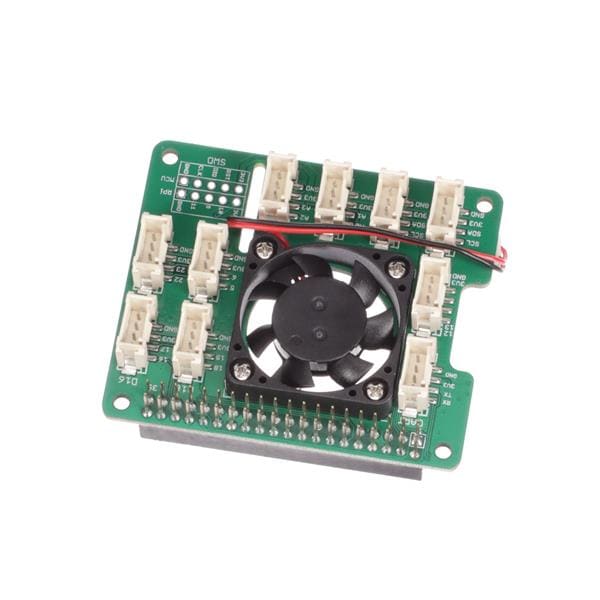
⭐ Grove - Thermal Imaging Camera - MLX90641 | Inspect
?? Also, huge thanks to Creality3D for sponsoring a Creality CR-6 SE 3D Printer.
?? If you want to purchase some products from Creality3D, you can use my 10% discount coupon (Aktar10) even for their new and most popular printers: CR-10 Smart,CR-30 3DPrintMill,Ender-3 Pro, and Ender-3 V2.
?? You can also use the coupon for Creality filaments, such as Upgraded PLA (200g x 5 Pack),PLA White, and PLA Black.


Step 1: Designing and printing a forest-themed case
As a novice in 3D model designing and printing, I decided to design a forest-themed case for this project to create a more compact and robust device operating flawlessly in the field.
I designed the main case and tree bases in Autodesk Fusion 360. You can download their STL files below.
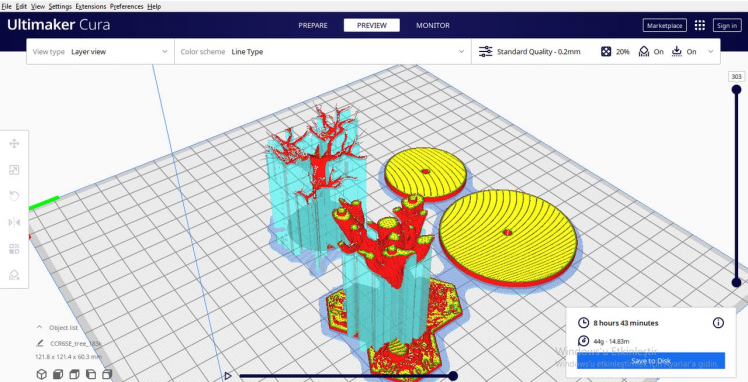
For trees mounted on the main case, I utilized these models from Thingiverse:
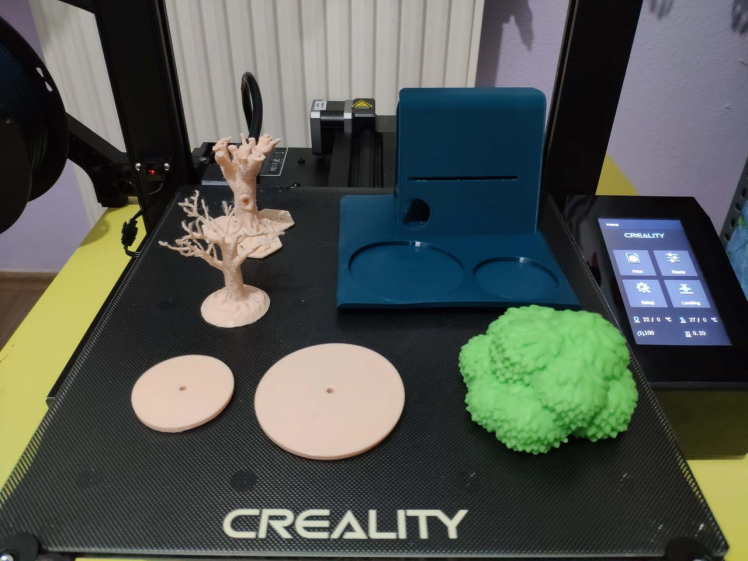
Since I wanted to apply a stylish forest theme to the device, I utilized three PLA filaments with different colors:
- Green
- Beige
- Peak Green
I sliced 3D models (STL files) for each color above in Ultimaker Cura.
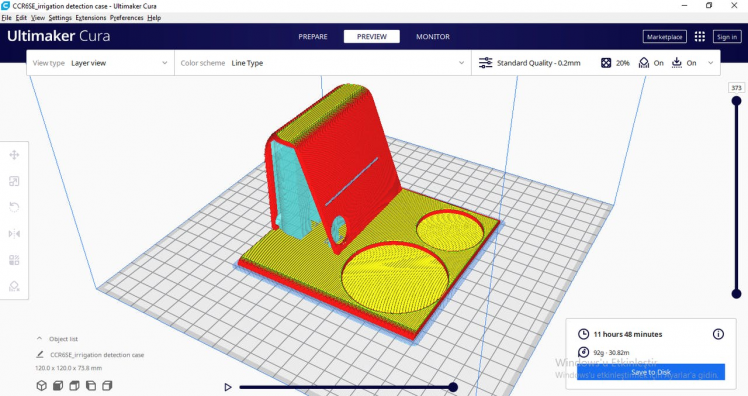
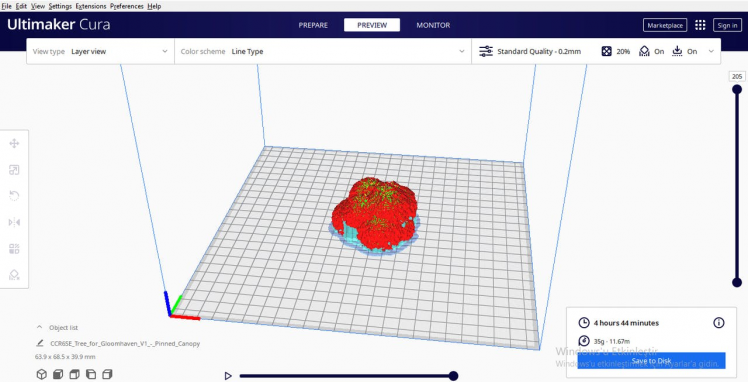
Finally, I printed all parts (models) with my Creality CR-6 SE 3D Printer. Although I am a beginner in 3D printing and it is my first 3D printer, I got incredible results effortlessly with the CR-6 SE :)
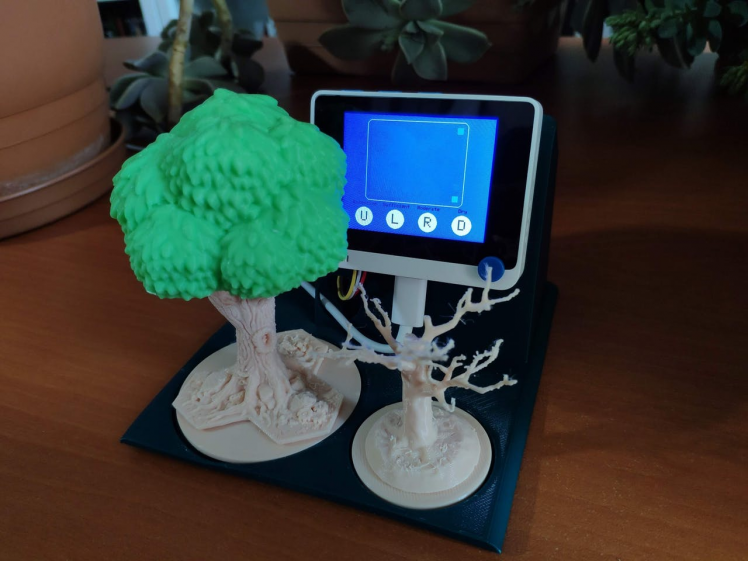
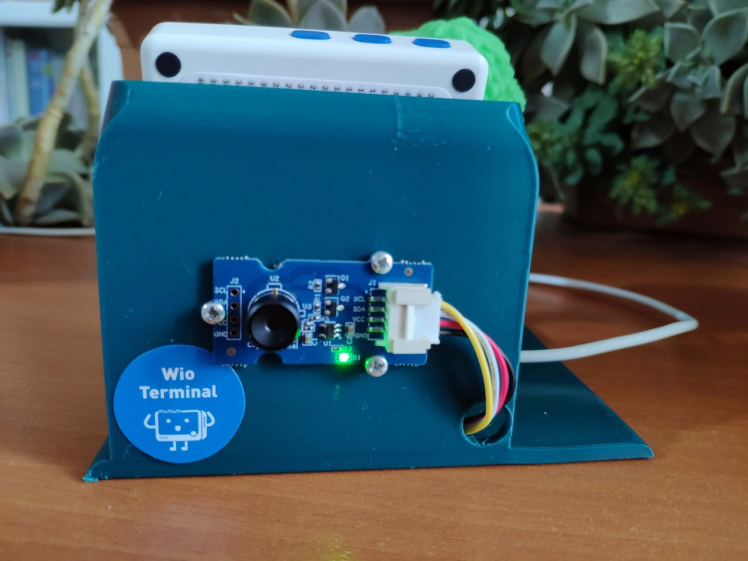
Step 1.1: Assembling the case and its components
After printing all parts (models) successfully, I fastened them together and attached the Wio Terminal and the MLX90641 thermal imaging camera to the case. I used a Grove connection cable (4 Pin) to connect the Wio Terminal to the MLX90641 thermal imaging camera.
Step 2: Developing a web application in PHP to collate data on irrigation levels by thermal imaging
Before collecting thermal imaging data with the Wio Terminal, I decided to develop a web application in PHP, named irrigation level data logger, so as to save and analyze data easily on my server hosted on Raspberry Pi.
As shown below, the web application consists of one file and has three parameters to create the required CSV files and collect data successfully:
- index.php
Parameters:
- create_files
- thermal_img
- level
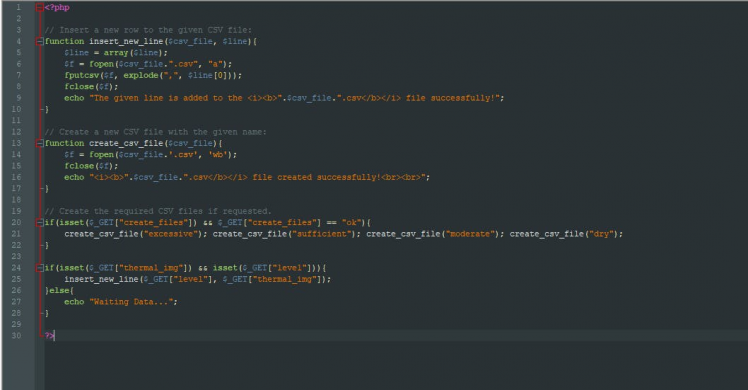
⭐ In the insert_new_line function, insert a new row to the given CSV file by using the fputcsv function. To avoid syntax errors in the CSV files, use the explode function to save the given data (array) successfully.
function insert_new_line($csv_file, $line){
	$line = array($line);
	$f = fopen($csv_file.".csv", "a");
	fputcsv($f, explode(",", $line[0]));
	fclose($f);
	echo "The given line is added to the <i><b>".$csv_file.".csv</b></i> file successfully!";
}
⭐ In the create_csv_file function, create a new CSV file with the given file name.
function create_csv_file($csv_file){
$f = fopen($csv_file.'.csv', 'wb');
fclose($f);
echo "<i><b>".$csv_file.".csv</b></i> file created successfully!<br><br>";
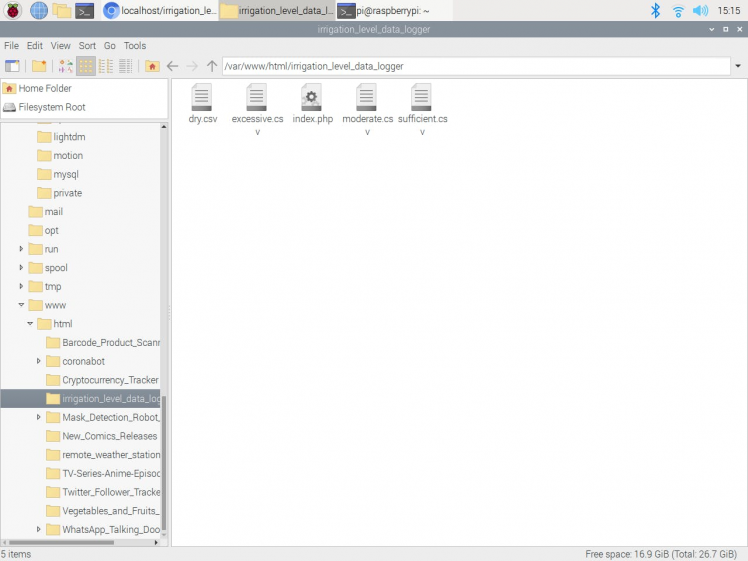
}⭐ If the create_files parameter is received and equals ok, then create the required CSV files to save and collect thermal imaging data. Each file name represents an irrigation class:
- dry.csv
- moderate.csv
- sufficient.csv
- excessive.csv
if(isset($_GET["create_files"]) && $_GET["create_files"] == "ok"){
	create_csv_file("excessive"); create_csv_file("sufficient"); create_csv_file("moderate"); create_csv_file("dry");
}
⭐ If the thermal_img and level parameters are received, then save the given thermal imaging data (array) to the given CSV file (one from above).
if(isset($_GET["thermal_img"]) && isset($_GET["level"])){
	insert_new_line($_GET["level"], $_GET["thermal_img"]);
}else{
	echo "Waiting Data...";
}
Step 2.1: Setting up the web application on Raspberry Pi
After creating the PHP web application, as mentioned above, I run the application on my server hosted on Raspberry Pi, but you can run it on any server as long as it is a PHP server.
If you want to use Raspberry Pi to run the application, as did I, but you do not know how to set up a LAMP web server on Raspberry Pi, you can inspect my previous tutorial.
⭐ First of all, install and extract the irrigation_level_data_logger.zip folder.
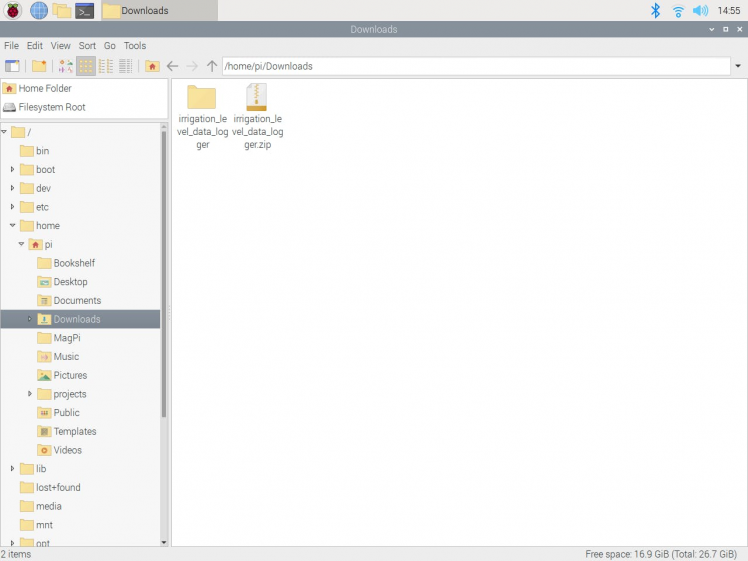
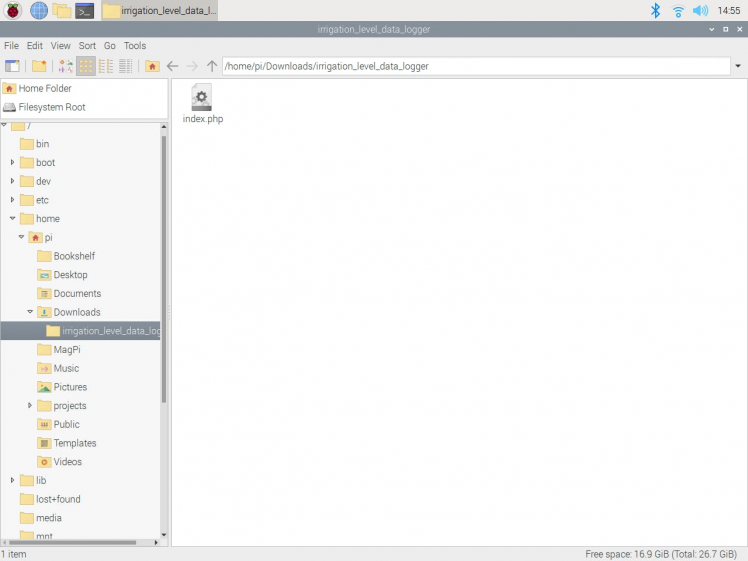
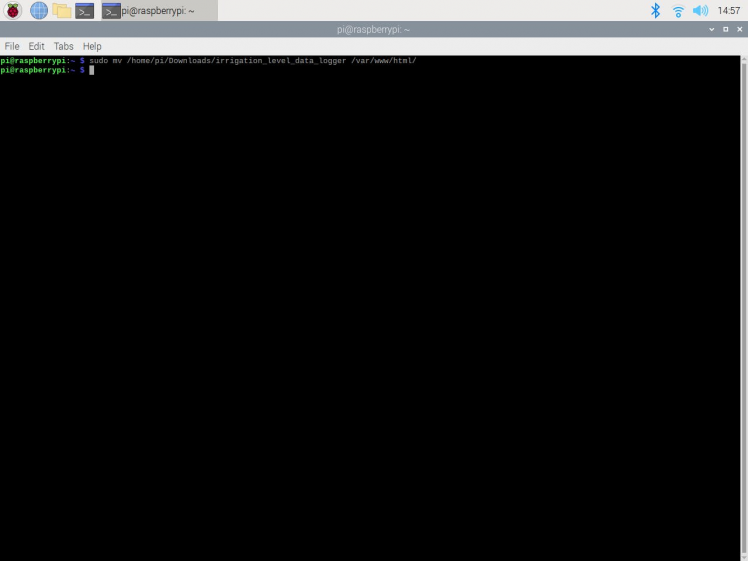
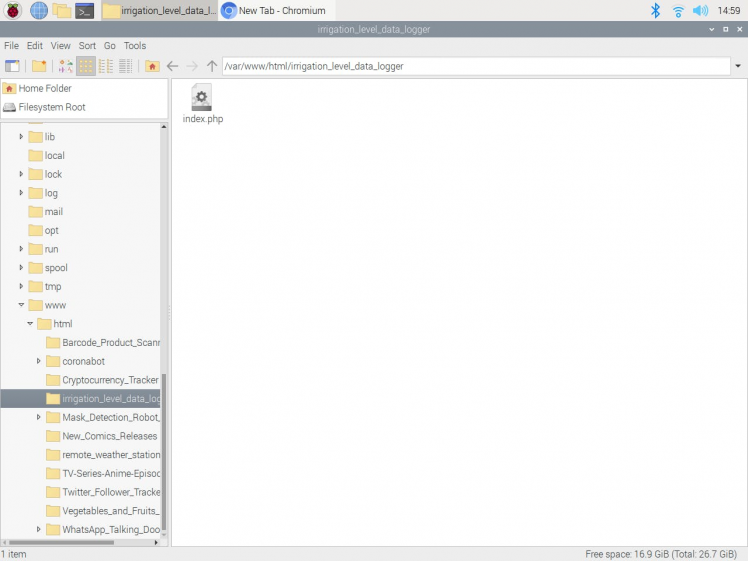
⭐ Then, move the application folder (irrigation_level_data_logger) to the Apache server (/var/www/html) by using the terminal since the Apache server is a protected location.
sudo mv /home/pi/Downloads/irrigation_level_data_logger /var/www/html/
Step 2.2: Running and testing the web application on Raspberry Pi
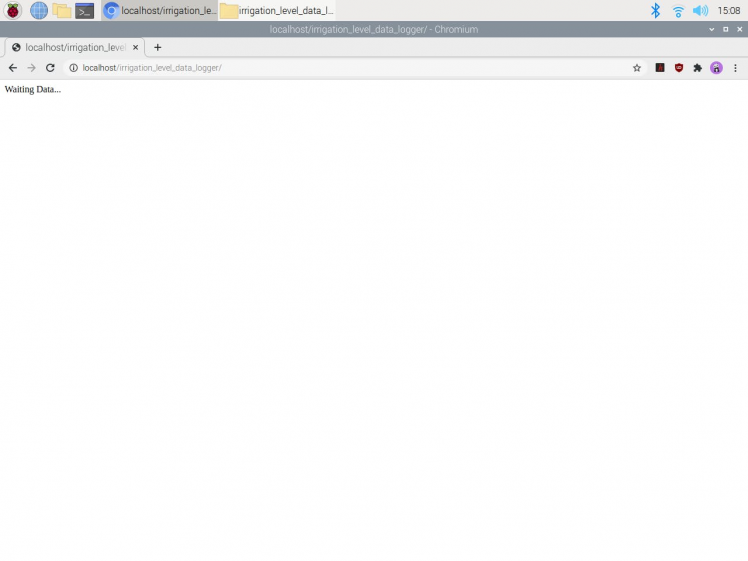
⭐ If the parameters are not set, the web application prints: Waiting Data...
http://localhost/irrigation_level_data_logger/
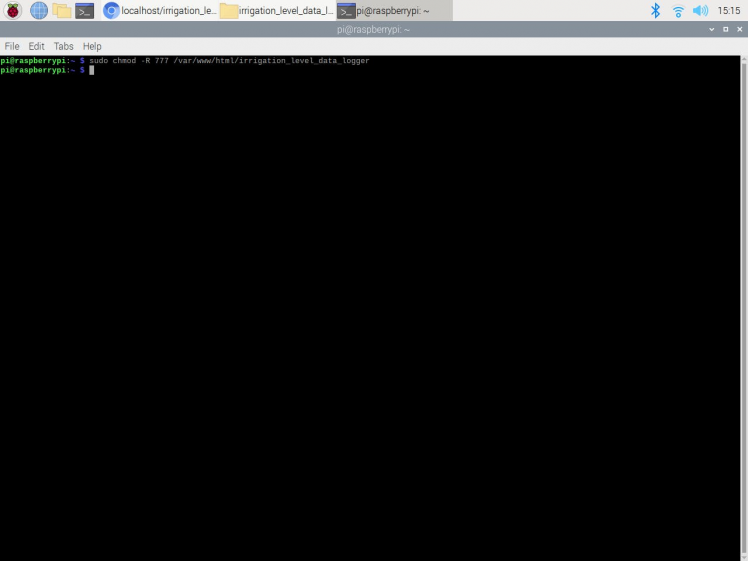
⭐ Since the Apache server is a protected location, it throws an error while attempting to modify the files and folders in it. Therefore, before utilizing the web application to create the required CSV files to save and collect thermal imaging data, change the web application's folder permission by using the terminal:
sudo chmod -R 777 /var/www/html/irrigation_level_data_logger
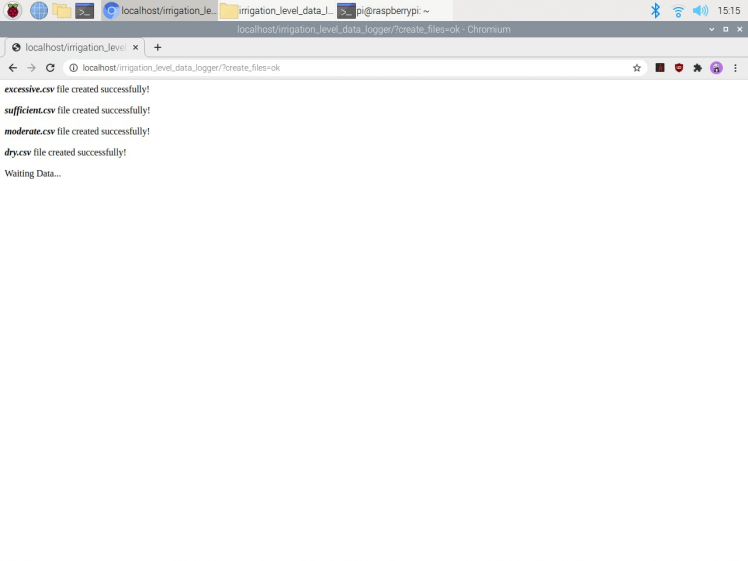
⭐ If the create_files parameter is received and equals ok, the web application creates the required CSV files (shown above) and prints recently created file names.
http://localhost/irrigation_level_data_logger/?create_files=ok
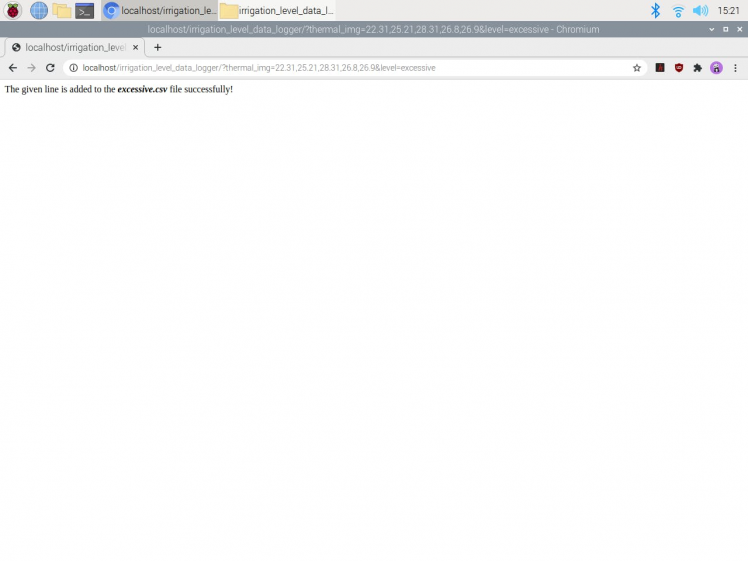
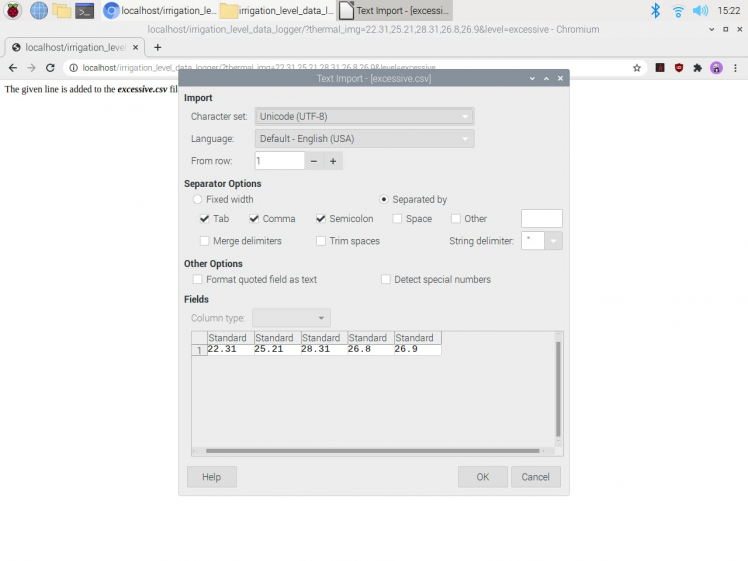
⭐ If the thermal_img (thermal imaging data) and level (CSV file name) parameters are received, the web application processes the given thermal imaging data as an array and inserts it into the given CSV file as a new row.
http://localhost/irrigation_level_data_logger/?thermal_img=<_data_>&level=<_file_name_>
⭐ Then, if the given thermal imaging data is inserted successfully, the application prints:
The given line is added to the <_file_name_>.csv file successfully!
Step 3: Updating and setting up Wio Terminal
Since the Wio Terminal provides Wi-Fi connectivity via the built-in Wireless Core Realtek RTL8720, I employed the Wio Terminal to display and transfer the thermal imaging data generated by the MLX90641 thermal imaging camera. However, before proceeding with the following steps, I needed to update the Wireless Core Firmware to the latest version to enable wireless connectivity since Seeed moved the Wi-Fi software to the new eRPC structure. Fortunately, Seeed provides a tool named ambd_flash_tool to erase the existing firmware on the RTL8720 and also flash the latest firmware.
I updated the Wireless Core Firmware on Windows. You can get more information from here for Mac/ Linux.
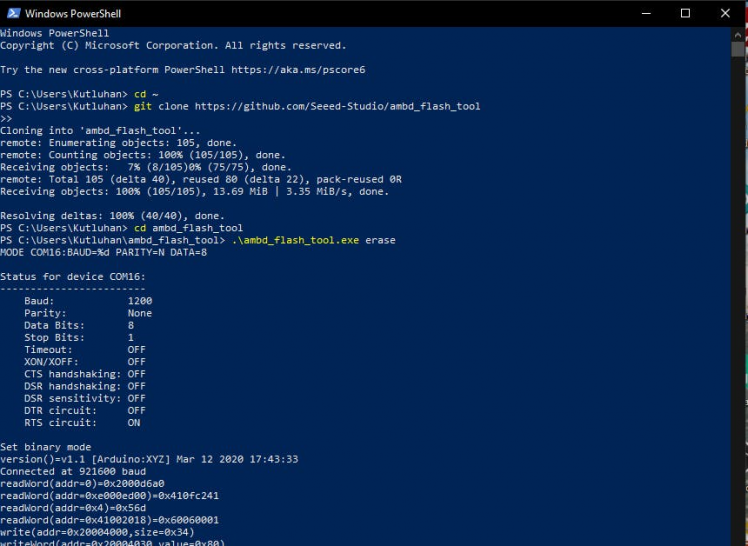
#️⃣ Open Windows PowerShell and execute the commands below to download the flashing tool.
cd ~
git clone https://github.com/Seeed-Studio/ambd_flash_tool
#️⃣ Navigate to the ambd_flash_tool directory:
cd ambd_flash_tool
#️⃣ Connect the Wio Terminal to the PC and turn it on.
#️⃣ Execute the following command to erase the initial firmware:
.ambd_flash_tool.exe erase
#️⃣ After erasing the initial firmware, inside the ambd_flash_tool directory, execute the following command to flash the latest firmware to the RTL8720:
.ambd_flash_tool.exe flash

After updating the Wireless Core Firmware successfully, I installed the Seeed SAMD Arduino Core on the Arduino IDE and downloaded the required libraries for this project.
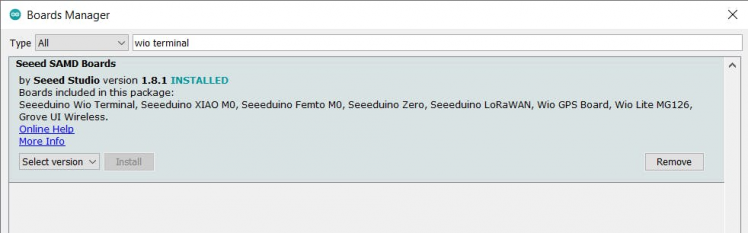
#️⃣ To set up the Seeed SAMD Arduino Core, open the Arduino IDE, click Tools ➡ Board ➡ Boards Manager, and search for Wio Terminal in the search box. Then, install Seeed SAMD Boards.
#️⃣ Download the required libraries for Wi-Fi connectivity:
Seeed_Arduino_rpcWiFi | Download
Seeed_Arduino_rpcUnified | Download
Seeed_Arduino_mbedtls | Download
Seeed_Arduino_FS | Download
Seeed_Arduino_SFUD | Download
#️⃣ Download the required library for the MLX90641 thermal imaging camera:
Seeed_Arduino_MLX9064x | Download
Step 4: Collecting and transferring irrigation level data by thermal imaging w/ Wio Terminal
After setting up the Wio Terminal and enabling Wi-Fi connectivity, I programmed the Wio Terminal to send the thermal imaging data generated by the MLX90641 thermal imaging camera to the web application.
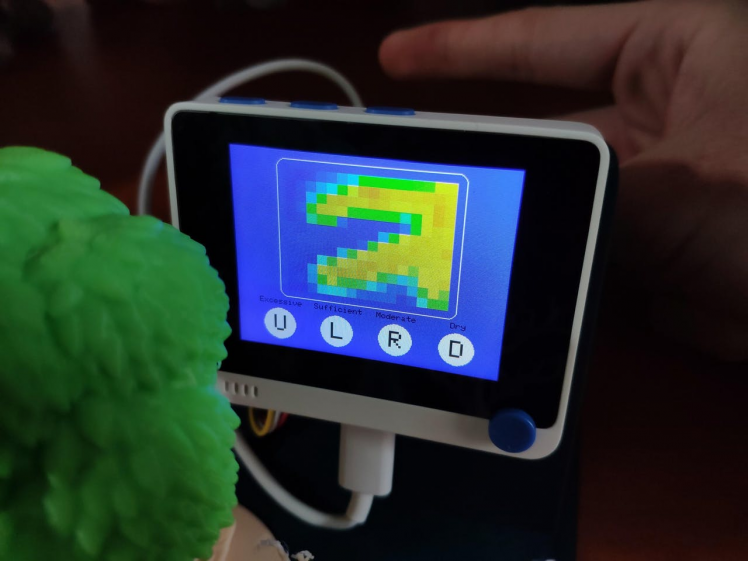
Since I needed to assign irrigation classes (labels) empirically for each thermal imaging array (input) to create a data set, I utilized the 5-way switch integrated into the Wio Terminal to choose among irrigation classes. After selecting an irrigation class, the Wio Terminal sends thermal imaging data (array) to the web application, and the web application saves the transferred data to the chosen class' CSV file:
- Up ➡ Excessive
- Left ➡ Sufficient
- Right ➡ Moderate
- Down ➡ Dry
You can download the irrigation_level_detection_data_collect.ino file to try and inspect the code for thermal imaging data collecting with Wio Terminal.
⭐ Include the required libraries.
#include <rpcWiFi.h>
#include <TFT_eSPI.h>
#include <Wire.h>
#include "MLX90641_API.h"
#include "MLX9064X_I2C_Driver.h"
⭐ Define the Wi-Fi network settings and use the WiFiClient class to create TCP connections.
const char* ssid = "<_SSID_>";
const char* password =  "<_PASSWORD_>";

// Define the server settings:
const uint16_t port = 80; // Default port
const char* host = "192.168.1.20";  // Target Server IP Address

// Use the WiFiClient class to create TCP connections:
WiFiClient client;
⭐ Define the MLX90641 thermal imaging camera settings.
⭐ Define the maximum and minimum temperature values.
const byte MLX90641_address = 0x33; // Default 7-bit unshifted address of the MLX90641.
#define TA_SHIFT 12 // Default shift value for MLX90641 in the open air.
uint16_t eeMLX90641[832];
float MLX90641To[192];
uint16_t MLX90641Frame[242];
paramsMLX90641 MLX90641;
int errorno = 0;
// Define the maximum and minimum temperature values:
uint16_t MinTemp = 21;
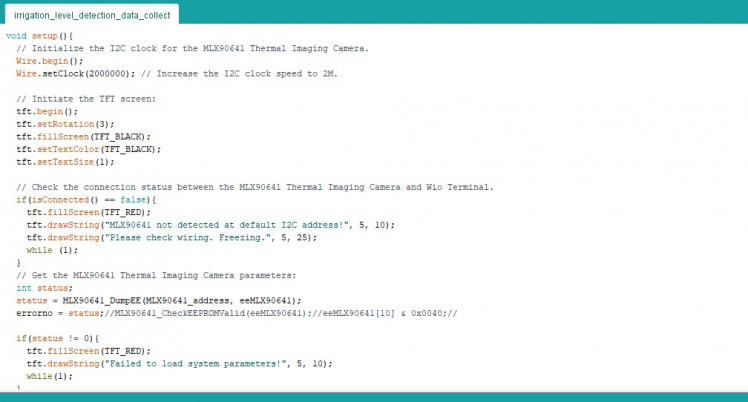
uint16_t MaxTemp = 45;⭐ Initialize the I2C clock for the MLX90641 thermal imaging camera.
Wire.begin();
  Wire.setClock(2000000); // Increase the I2C clock speed to 2M.
⭐ Initiate the TFT screen.
tft.begin();
  tft.setRotation(3);
  tft.fillScreen(TFT_BLACK);
  tft.setTextColor(TFT_BLACK);
  tft.setTextSize(1);
⭐ Check the connection status between the MLX90641 thermal imaging camera and the Wio Terminal.
if(isConnected() == false){
    tft.fillScreen(TFT_RED);
    tft.drawString("MLX90641 not detected at default I2C address!", 5, 10);
    tft.drawString("Please check wiring. Freezing.", 5, 25);
    while (1);
  }
⭐ Get the MLX90641 thermal imaging camera parameters. Once params are extracted, release the eeMLX90641 array.
MLX90641_SetRefreshRate(MLX90641_address, 0x05); // Set rate to 16Hz.⭐ In the Getabcd function, get the cutoff points based on the given maximum and minimum temperature values.
void Getabcd() {
  // Get the cutoff points based on the given maximum and minimum temperature values.
  a = MinTemp + (MaxTemp - MinTemp) * 0.2121;
  b = MinTemp + (MaxTemp - MinTemp) * 0.3182;
  c = MinTemp + (MaxTemp - MinTemp) * 0.4242;
  d = MinTemp + (MaxTemp - MinTemp) * 0.8182;
}
⭐ Set the Wi-Fi module to station mode and disconnect from an AP if it was previously connected.
⭐ Attempt to connect to the given Wi-Fi network.
WiFi.mode(WIFI_STA);
WiFi.disconnect();
delay(2000);
WiFi.begin(ssid, password);
// Attempt to connect to the given Wi-Fi network:
while(WiFi.status() != WL_CONNECTED){
delay(500);
tft.fillScreen(TFT_RED);
tft.drawString("Connecting to Wi-Fi...", 5, 10);
}
tft.setTextSize(2);
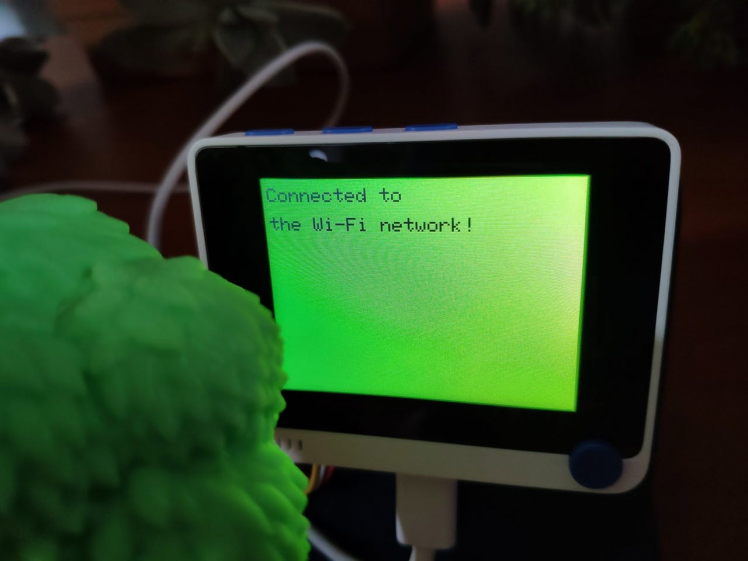
tft.fillScreen(TFT_GREENYELLOW);
tft.drawString("Connected to", 5, 10);
tft.drawString("the Wi-Fi network!", 5, 40);
delay(3000);
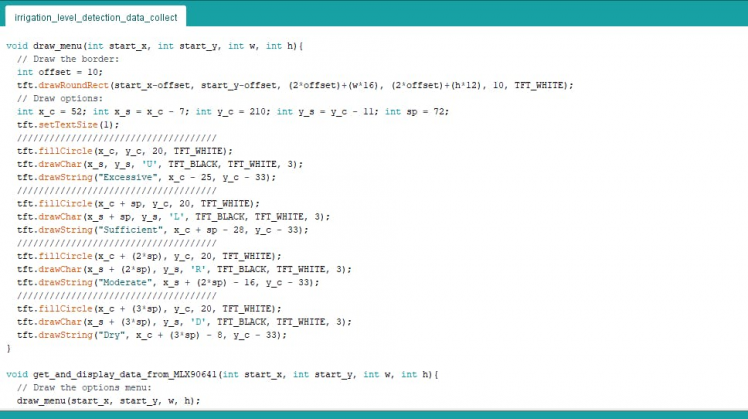
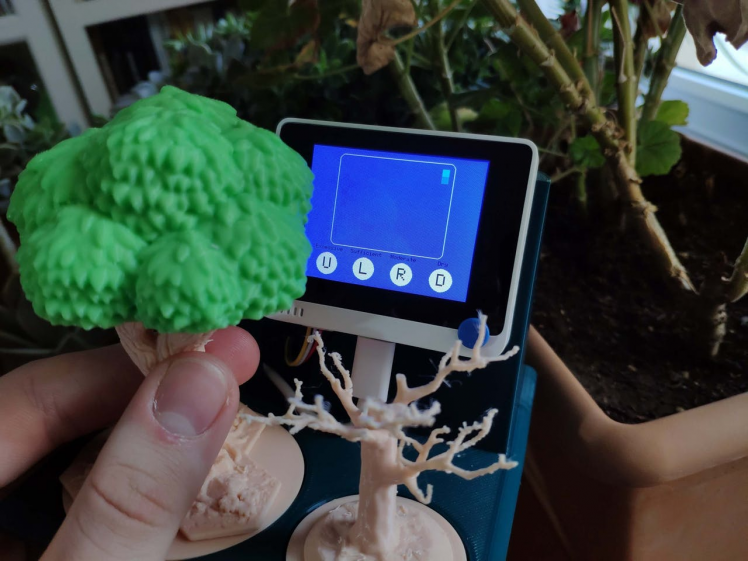
tft.fillScreen(TFT_BLUE);⭐ In the draw_menu function, draw the irrigation class options (Up, Left, Right, Down) and the border of the simple image generated from the thermal imaging array (16x12).
void draw_menu(int start_x, int start_y, int w, int h){
// Draw the border:
int offset = 10;
tft.drawRoundRect(start_x-offset, start_y-offset, (2*offset)+(w*16), (2*offset)+(h*12), 10, TFT_WHITE);
// Draw options:
int x_c = 52; int x_s = x_c - 7; int y_c = 210; int y_s = y_c - 11; int sp = 72;
tft.setTextSize(1);
/////////////////////////////////////
tft.fillCircle(x_c, y_c, 20, TFT_WHITE);
tft.drawChar(x_s, y_s, 'U', TFT_BLACK, TFT_WHITE, 3);
tft.drawString("Excessive", x_c - 25, y_c - 33);
/////////////////////////////////////
tft.fillCircle(x_c + sp, y_c, 20, TFT_WHITE);
tft.drawChar(x_s + sp, y_s, 'L', TFT_BLACK, TFT_WHITE, 3);
tft.drawString("Sufficient", x_c + sp - 28, y_c - 33);
/////////////////////////////////////
tft.fillCircle(x_c + (2*sp), y_c, 20, TFT_WHITE);
tft.drawChar(x_s + (2*sp), y_s, 'R', TFT_BLACK, TFT_WHITE, 3);
tft.drawString("Moderate", x_s + (2*sp) - 16, y_c - 33);
/////////////////////////////////////
tft.fillCircle(x_c + (3*sp), y_c, 20, TFT_WHITE);
tft.drawChar(x_s + (3*sp), y_s, 'D', TFT_BLACK, TFT_WHITE, 3);
tft.drawString("Dry", x_c + (3*sp) - 8, y_c - 33);
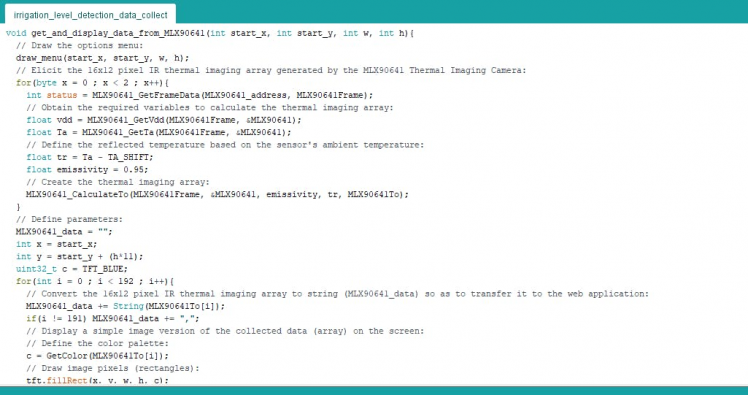
}⭐ In the get_and_display_data_from_MLX90641 function, after executing the draw_menu function, elicit the 16x12 pixel IR thermal imaging array generated by the MLX90641 thermal imaging camera:
⭐ Obtain the required variables to calculate the thermal imaging array.
⭐ Define the reflected temperature based on the sensor's ambient temperature.
⭐ Create the thermal imaging array.
⭐ Then, convert the 16x12 pixel IR thermal imaging array to string (MLX90641_data) so as to transfer it to the web application.
⭐ To display a simple image version of the recently generated thermal imaging array (16x12) on the screen, assign colors for each element (pixel) in the array by using the GetColor function.
⭐ Finally, draw each pixel (rectangle) to create a simple image version of the given thermal imaging array.
void get_and_display_data_from_MLX90641(int start_x, int start_y, int w, int h){
  // Draw the options menu:
  draw_menu(start_x, start_y, w, h);
  // Elicit the 16x12 pixel IR thermal imaging array generated by the MLX90641 Thermal Imaging Camera:
  for(byte x = 0 ; x < 2 ; x++){
    int status = MLX90641_GetFrameData(MLX90641_address, MLX90641Frame);
    // Obtain the required variables to calculate the thermal imaging array:
    float vdd = MLX90641_GetVdd(MLX90641Frame, &MLX90641);
    float Ta = MLX90641_GetTa(MLX90641Frame, &MLX90641);
    // Define the reflected temperature based on the sensor's ambient temperature:
    float tr = Ta - TA_SHIFT;
    float emissivity = 0.95;
    // Create the thermal imaging array:
    MLX90641_CalculateTo(MLX90641Frame, &MLX90641, emissivity, tr, MLX90641To);
  }
  // Define parameters:
  MLX90641_data = "";
  int x = start_x;
  int y = start_y + (h*11);
  uint32_t c = TFT_BLUE;
  for(int i = 0 ; i < 192 ; i++){
    // Convert the 16x12 pixel IR thermal imaging array to string (MLX90641_data) so as to transfer it to the web application:
    MLX90641_data += String(MLX90641To[i]);
    if(i != 191) MLX90641_data += ",";
    // Display a simple image version of the collected data (array) on the screen:
    // Define the color palette:
    c = GetColor(MLX90641To[i]);
    // Draw image pixels (rectangles):
    tft.fillRect(x, y, w, h, c);
    x = x + w;
    // Start a new row:
    int l = i + 1;
    if (l%16 == 0) { x = start_x; y = y - h; }
  }
}
⭐ The GetColor function utilizes the built-in color mapping function to get a 5-6-5 color palette (R=5 bits, G=6 bits, B-5 bits) for each pixel according to the equations applied in the function.
uint16_t GetColor(float val){
// Assign colors to the given temperature readings:
// R:
red = constrain(255.0 / (c - b) * val - ((b * 255.0) / (c - b)), 0, 255);
// G:
if((val > MinTemp) & (val < a)){
green = constrain(255.0 / (a - MinTemp) * val - (255.0 * MinTemp) / (a - MinTemp), 0, 255);
}else if((val >= a) & (val <= c)){
green = 255;
}else if(val > c){
green = constrain(255.0 / (c - d) * val - (d * 255.0) / (c - d), 0, 255);
}else if((val > d) | (val < a)){
green = 0;
}
// B:
if(val <= b){
blue = constrain(255.0 / (a - b) * val - (255.0 * b) / (a - b), 0, 255);
}else if((val > b) & (val <= d)){
blue = 0;
}else if (val > d){
blue = constrain(240.0 / (MaxTemp - d) * val - (d * 240.0) / (MaxTemp - d), 0, 240);
}
// Utilize the built-in color mapping function to get a 5-6-5 color palette (R=5 bits, G=6 bits, B-5 bits):
return tft.color565(red, green, blue);
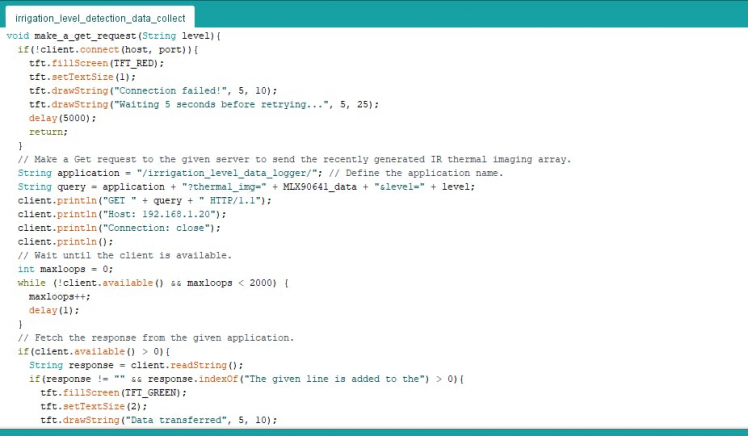
}⭐ In the make_a_get_request function, make a Get request to the given server to send the recently generated IR thermal imaging array to the given web application (irrigation_level_data_logger).
⭐ Wait until the client is available, then fetch the response from the given application.
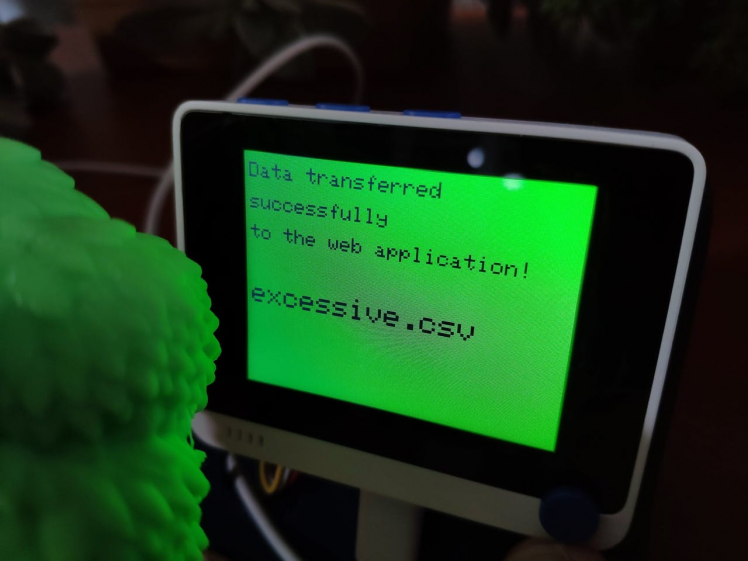
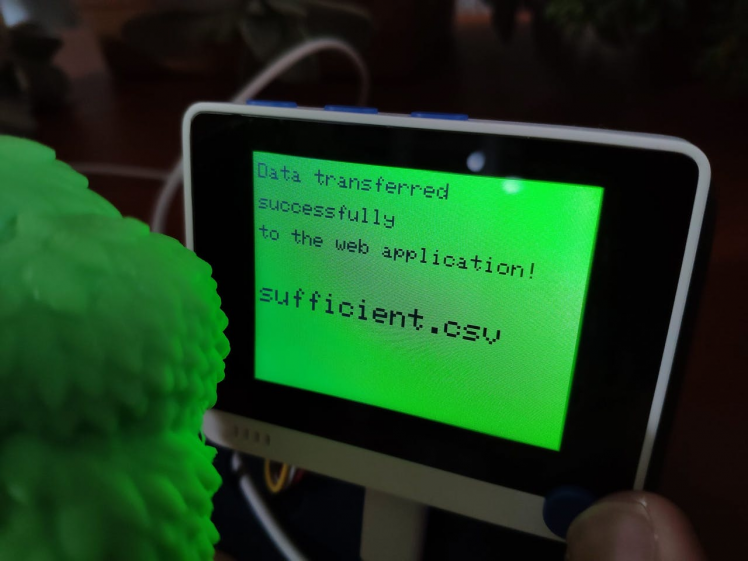
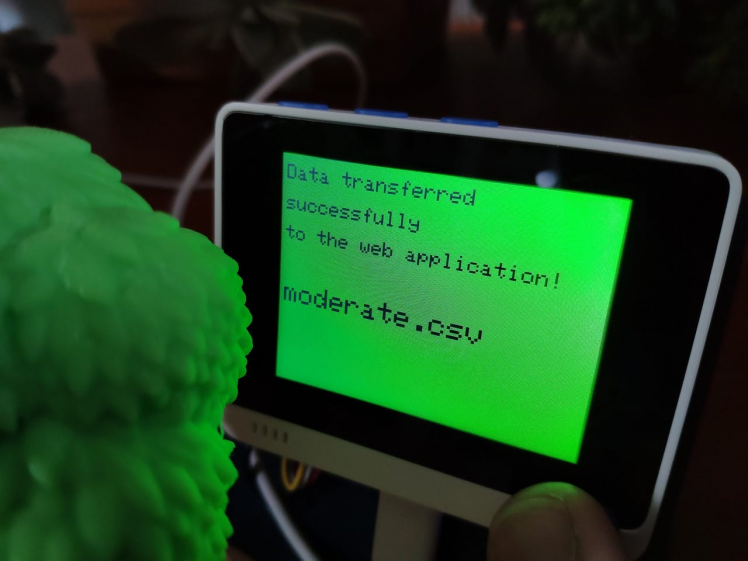
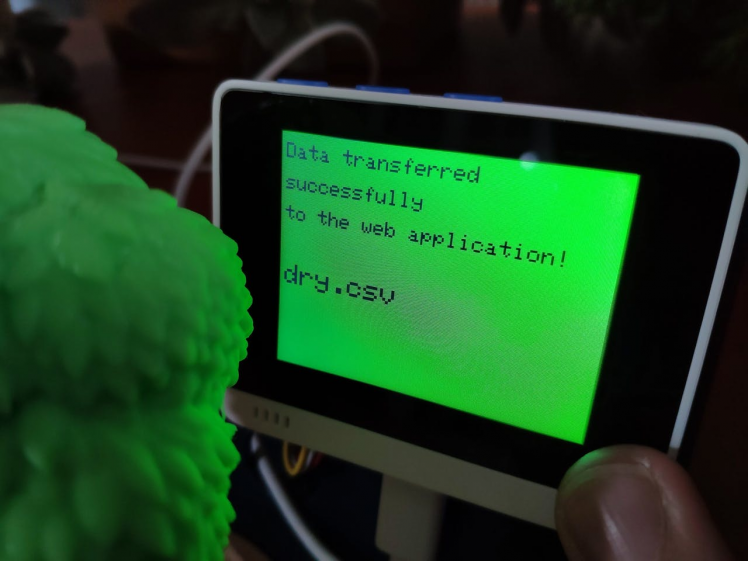
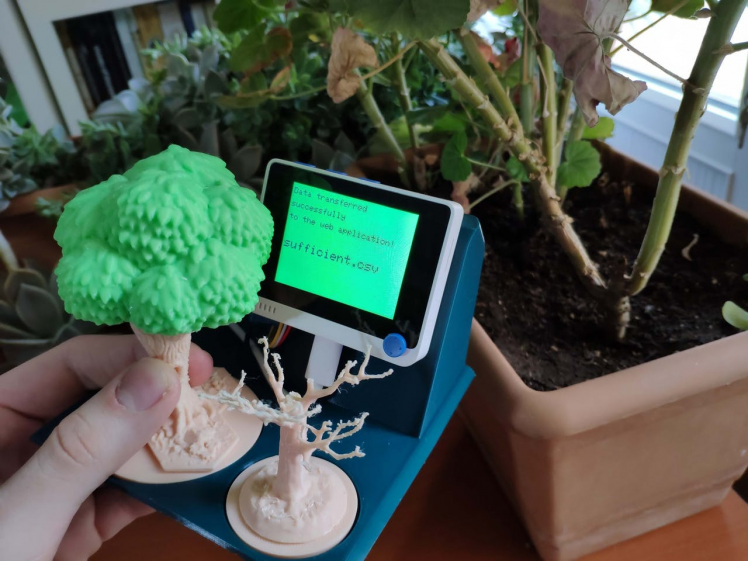
⭐ If the web application saves the transferred thermal imaging data (array) to the chosen irrigation class' CSV file, then print the message below, including the CSV file name:
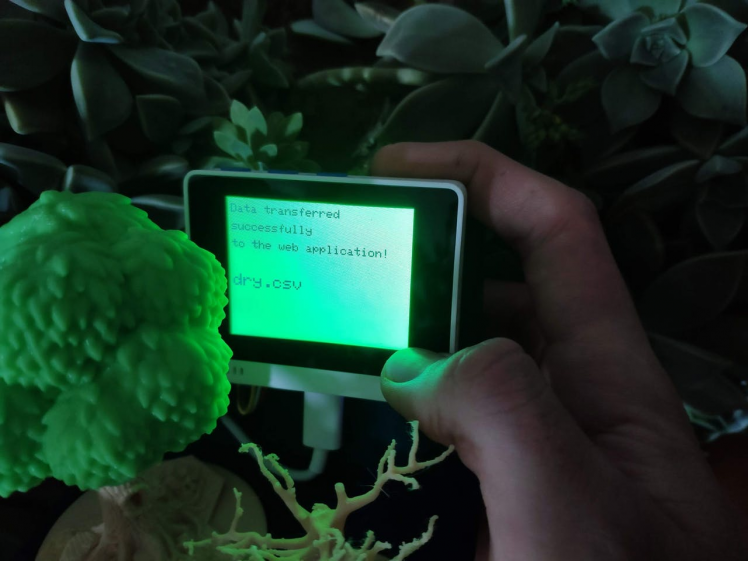
Data transferred successfully to the web application!
<file_name>.csv
void make_a_get_request(String level){
if(!client.connect(host, port)){
tft.fillScreen(TFT_RED);
tft.setTextSize(1);
tft.drawString("Connection failed!", 5, 10);
tft.drawString("Waiting 5 seconds before retrying...", 5, 25);
delay(5000);
return;
}
// Make a Get request to the given server to send the recently generated IR thermal imaging array.
String application = "/irrigation_level_data_logger/"; // Define the application name.
String query = application + "?thermal_img=" + MLX90641_data + "&level=" + level;
client.println("GET " + query + " HTTP/1.1");
client.println("Host: 192.168.1.20");
client.println("Connection: close");
client.println();
// Wait until the client is available.
int maxloops = 0;
while (!client.available() && maxloops < 2000) {
maxloops++;
delay(1);
}
// Fetch the response from the given application.
if(client.available() > 0){
String response = client.readString();
if(response != "" && response.indexOf("The given line is added to the") > 0){
tft.fillScreen(TFT_GREEN);
tft.setTextSize(2);
tft.drawString("Data transferred", 5, 10);
tft.drawString("successfully", 5, 40);
tft.drawString("to the web application! ", 5, 70);
tft.setTextSize(3);
tft.drawString(level + ".csv", 5, 130);
}
}else{
tft.fillScreen(TFT_RED);
tft.setTextSize(2);
tft.drawString("Client Timeout!", 5, 10);
}
// Stop the client:
client.stop();
delay(3000);
tft.fillScreen(TFT_BLUE);
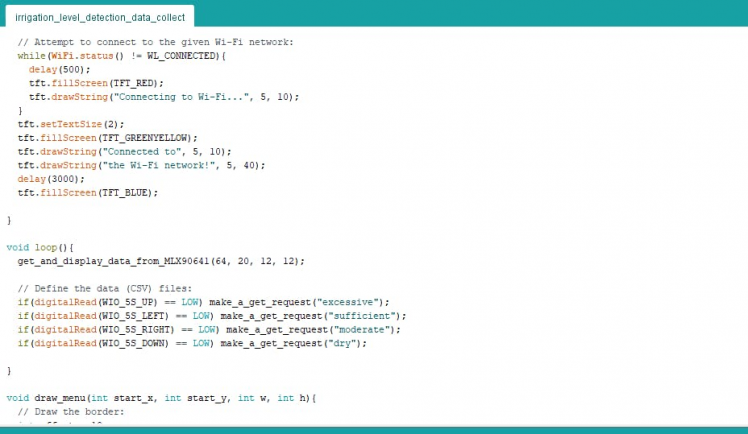
}⭐ According to the movement of the 5-way switch (Up, Left, Right, Down), send the recently generated thermal imaging array with the chosen irrigation class name to the web application.
get_and_display_data_from_MLX90641(64, 20, 12, 12);

  // Define the data (CSV) files:
  if(digitalRead(WIO_5S_UP) == LOW) make_a_get_request("excessive");
  if(digitalRead(WIO_5S_LEFT) == LOW) make_a_get_request("sufficient");
  if(digitalRead(WIO_5S_RIGHT) == LOW) make_a_get_request("moderate");
  if(digitalRead(WIO_5S_DOWN) == LOW) make_a_get_request("dry");

Step 4.1: Creating the irrigation level data set by thermal imaging
After uploading and running the code for thermal imaging data collecting on the Wio Terminal:
?? The device displays thermal imaging arrays as a real-time video stream on the screen.
?? When the Wi-Fi module is connected to the given Wi-Fi network successfully, the device prints: Connected to the Wi-Fi network!
?? If the 5-way switch is positioned to the Up, the device sends the recently generated thermal imaging array to the web application with the excessive irrigation class. Then, if the web application saves the given thermal imaging data successfully to the excessive.csv file, the device shows:
?? If the 5-way switch is positioned to the Left, the device sends the recently generated thermal imaging array to the web application with the sufficient irrigation class. Then, if the web application saves the given thermal imaging data successfully to the sufficient.csv file, the device shows:
?? If the 5-way switch is positioned to the Right, the device sends the recently generated thermal imaging array to the web application with the moderate irrigation class. Then, if the web application saves the given thermal imaging data successfully to the moderate.csv file, the device shows:
?? If the 5-way switch is positioned to the Down, the device sends the recently generated thermal imaging array to the web application with the dry irrigation class. Then, if the web application saves the given thermal imaging data successfully to the dry.csv file, the device shows:
To train my neural network model so as to make predictions on the irrigation levels (classes) based on thermal imaging, I needed to create a data set with eminent validity. Therefore, I utilized the device to collect thermal imaging data from my plants with different irrigation levels for over one month.
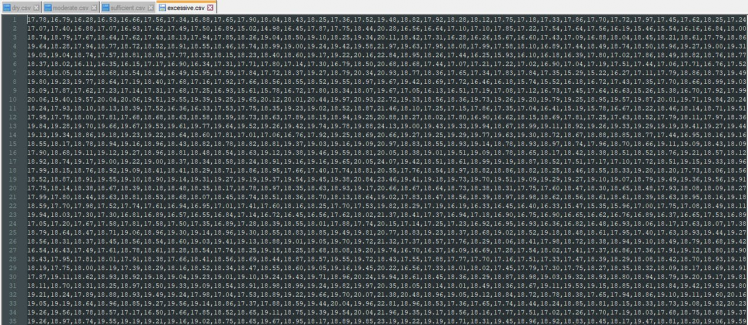
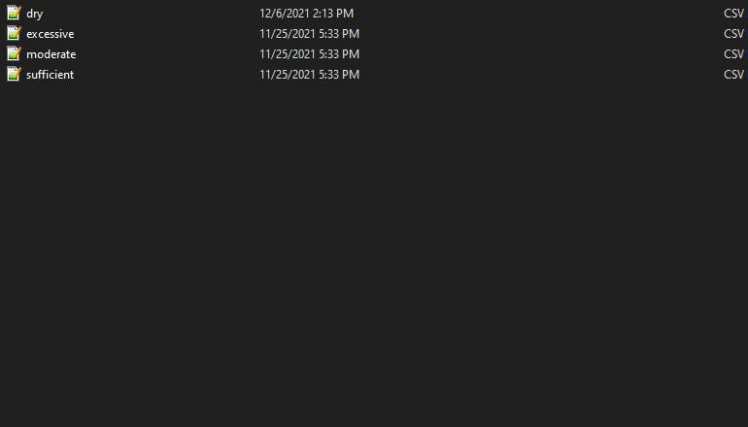
Finally, I had a data set with 1264 inputs in total under these CSV files in the web application:
- dry.csv
- moderate.csv
- sufficient.csv
- excessive.csv
Step 5: Building an Artificial Neural Network (ANN) with TensorFlow
When I completed collating my irrigation level data set by thermal imaging, I had started to work on my artificial neural network model (ANN) to make predictions on the irrigation levels (classes) based on thermal imaging.
I decided to create my neural network model with TensorFlow in Python. Thus, first of all, I followed the steps below to grasp a better understanding of my data set so as to train my model accurately:
- Data Merging (Combining)
- Data Scaling (Normalizing)
- Data Preprocessing
- Data Splitting
As explained in the previous steps, the web application saves the thermal imaging data under four different CSV files according to the empirically chosen irrigation classes. Since the thermal imaging data was already separated by irrigation classes, I preprocessed my data set effortlessly to assign labels for each thermal imaging array (input):
- 0 — Dry
- 1 — Moderate
- 2 — Sufficient
- 3 — Excessive
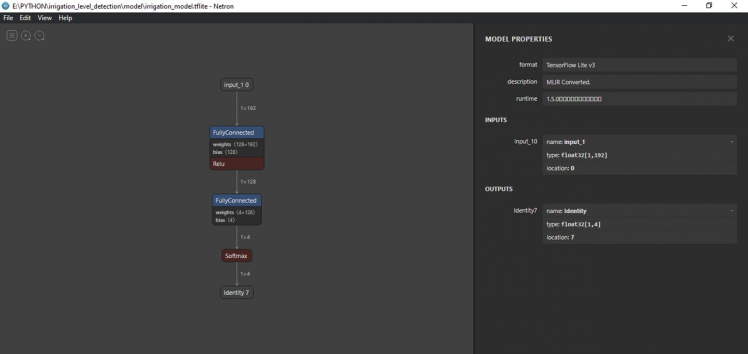
Since the MLX90641 thermal imaging camera generates 16x12 pixel IR arrays, after scaling (normalizing) and preprocessing inputs, I obtained 192 input variables and one label for each thermal imaging array in my data set. Then, I built an artificial neural network model with TensorFlow and trained it with my training data set to acquire the best results and predictions possible.
Layers:
- 192 [Input]
- 128 [Hidden]
- 4 [Output]
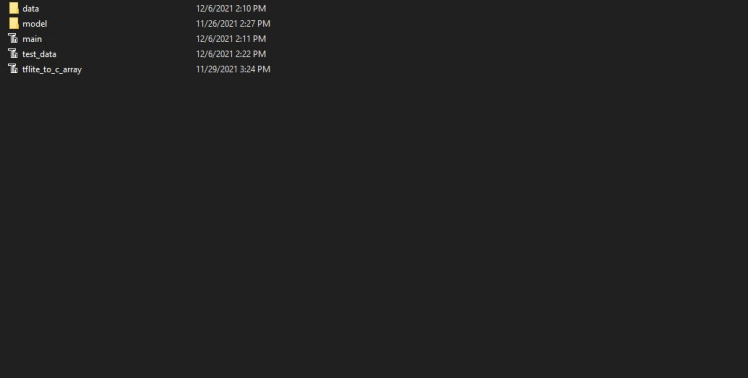
To execute all steps above and convert my model from a TensorFlow Keras H5 model to a C array (.h file) to run the model on the Wio Terminal, I developed an application in Python. As shown below, the application consists of three code files and two folders:
- main.py
- test_data.py
- tflite_to_c_array.py
- /data
- /model
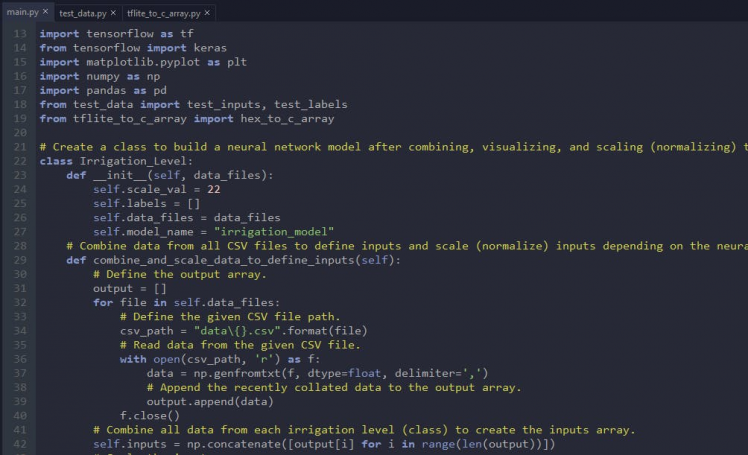
First of all, I created a class named Irrigation_Level in the main.py file to execute the following functions precisely.
⭐ Include the required modules.
import tensorflow as tf
from tensorflow import keras
import matplotlib.pyplot as plt
import numpy as np
import pandas as pd
from test_data import test_inputs, test_labels
from tflite_to_c_array import hex_to_c_array
⭐ In the __init__ function, define the required variables for building the neural network model.
def __init__(self, data_files):
        self.scale_val = 22
        self.labels = []
        self.data_files = data_files
        self.model_name = "irrigation_model"
I will elucidate each file and function in detail in the following steps.
Step 5.1: Merging and scaling (normalizing) the input data and assigning labels (irrigation classes)
Since the thermal imaging data is separated under four different CSV files with irrigation class names in the web application, as shown below, I needed to merge (combine) and preprocess all data before proceeding.
To be able to read CSV files in Python, I moved all CSV files from the web application to the data folder:
- dry.csv
- moderate.csv
- sufficient.csv
- excessive.csv
After merging (combining) all thermal imaging data, I utilized each thermal imaging array generated by the MLX90641 thermal imaging camera in my data set as an input. Then, I scaled (normalized) each input to format the input data properly.
⭐ In the combine_and_scale_data_to_define_inputs funtion, merge (combine) thermal imaging data from all CSV files to create inputs:
⭐ Define the output array.
⭐ Read data from all CSV files in the given file list as NumPy arrays by using the genfromtxt function.
⭐ Then, append the recently collated data for each CSV file as NumPy arrays to the output array.
⭐ Finally, merge all NumPy arrays in the output array as the inputs NumPy array by using the concatenate function.
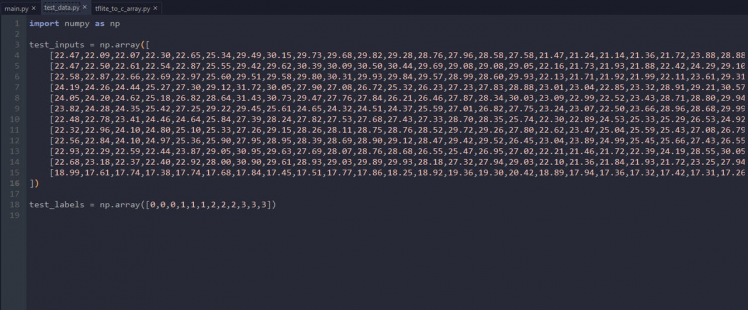
⭐ Each input includes 192 parameters [shape=(192, )]:
- [22.31, 22.66, 22.39, 22.25, 22.80, 25.00, 28.80, 28.84,...]
⭐ After creating the inputs array, divide it by 22 (scale value) to format the input data properly.
def combine_and_scale_data_to_define_inputs(self):
        # Define the output array.
        output = []
        for file in self.data_files:
            # Define the given CSV file path.
            csv_path = "data{}.csv".format(file)
            # Read data from the given CSV file.
            with open(csv_path, 'r') as f:
                data = np.genfromtxt(f, dtype=float, delimiter=',')
                # Append the recently collated data to the output array.
                output.append(data)
            f.close()
        # Combine all data from each irrigation level (class) to create the inputs array.
        self.inputs = np.concatenate([output[i] for i in range(len(output))])
        # Scale the inputs array.
        self.inputs = self.inputs / self.scale_val
After creating inputs from thermal imaging arrays, I needed to assign labels to train my neural network model.
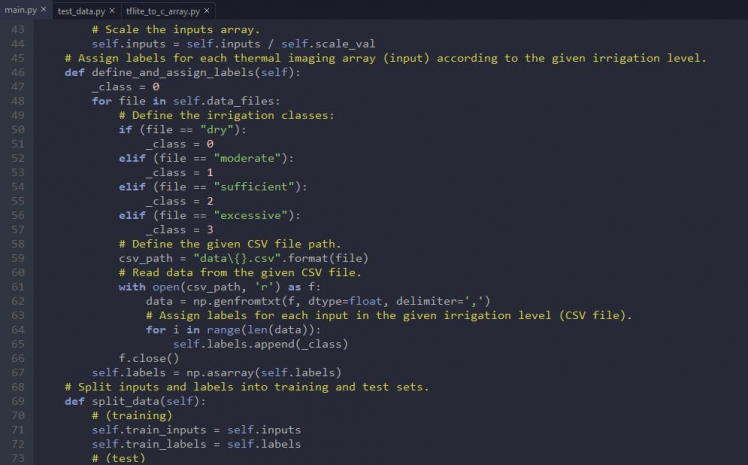
⭐ In the define_and_assign_labels function, define irrigation classes for each CSV file in the given file list:
- 0 — Dry
- 1 — Moderate
- 2 — Sufficient
- 3 — Excessive
⭐ Read data from all CSV files.
⭐ For each thermal imaging array (input) in a given CSV file, append its assigned label (irrigation class) [0 - 3] to the labels array.
⭐ Then, convert the labels array to a NumPy array by using the asarray function.
def define_and_assign_labels(self):
        _class = 0
        for file in self.data_files:
            # Define the irrigation classes:
            if (file == "dry"):
                _class = 0
            elif (file == "moderate"):
                _class = 1
            elif (file == "sufficient"):
                _class = 2
            elif (file == "excessive"):
                _class = 3
            # Define the given CSV file path.
            csv_path = "data{}.csv".format(file)
            # Read data from the given CSV file.
            with open(csv_path, 'r') as f:
                data = np.genfromtxt(f, dtype=float, delimiter=',')
                # Assign labels for each input in the given irrigation level (CSV file).
                for i in range(len(data)):
                    self.labels.append(_class)
            f.close()
        self.labels = np.asarray(self.labels)
Step 5.2: Training the model (ANN) on the irrigation levels (classes)
Since my irrigation level data set by thermal imaging is already limited (1264 inputs and labels), I decided to utilize all of my data set as the training data set instead of splitting it into training and testing data sets. Thus, I created a separate testing data set in the test_data.py file.
After defining training and testing data sets, I scaled (normalized) the testing data set inputs to format them properly.
def split_data(self):
# (training)
self.train_inputs = self.inputs
self.train_labels = self.labels
# (test)
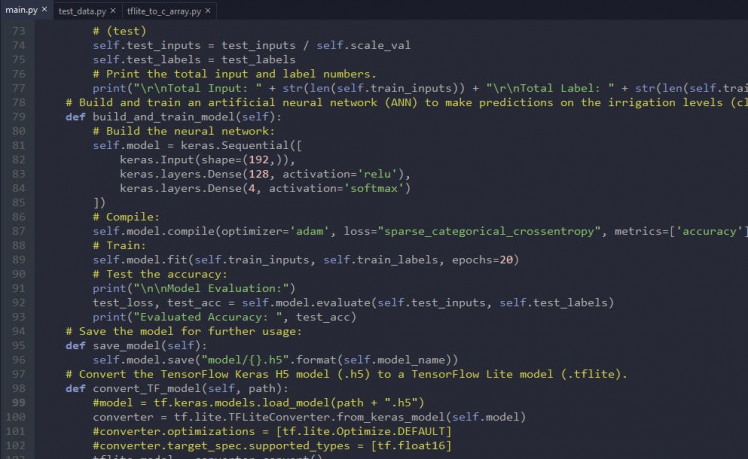
self.test_inputs = test_inputs / self.scale_val
self.test_labels = test_labels
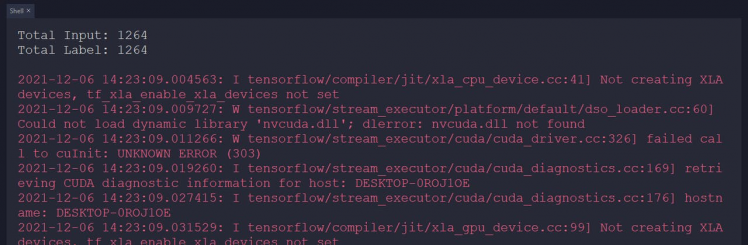
# Print the total input and label numbers.
print("rnTotal Input: " + str(len(self.train_inputs)) + "rnTotal Label: " + str(len(self.train_labels)) + "rn")Then, I built my artificial neural network model (ANN) by using Keras and trained it with the training set for twenty epochs.
You can inspect these tutorials to learn about activation functions, loss functions, epochs, etc.
def build_and_train_model(self):
# Build the neural network:
self.model = keras.Sequential([
keras.Input(shape=(192,)),
keras.layers.Dense(128, activation='relu'),
keras.layers.Dense(4, activation='softmax')
])
# Compile:
self.model.compile(optimizer='adam', loss="sparse_categorical_crossentropy", metrics=['accuracy'])
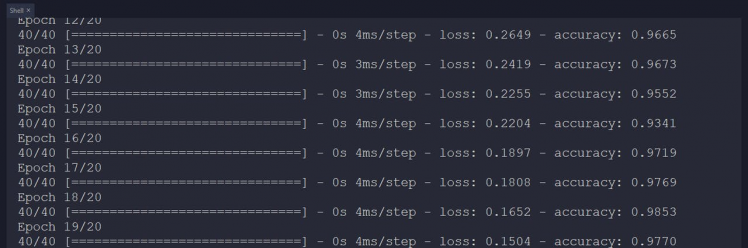
# Train:
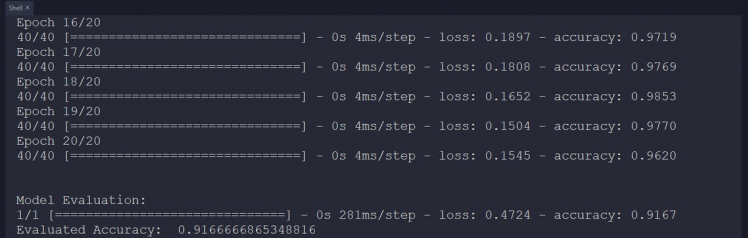
self.model.fit(self.train_inputs, self.train_labels, epochs=20)
...
After training with the training set (1264 inputs and labels), the accuracy of my neural network model is between 0.93 and 0.97.
Step 5.3: Evaluating the model accuracy and converting the model to a C array
After building and training my artificial neural network model, I tested its accuracy and validity by utilizing the testing data set (inputs and labels).
The evaluated accuracy of the model is 0.9167.
...

        # Test the accuracy:
        print("nnModel Evaluation:")
        test_loss, test_acc = self.model.evaluate(self.test_inputs, self.test_labels)
        print("Evaluated Accuracy: ", test_acc)
After evaluating my neural network model, I saved it as a TensorFlow Keras H5 model (irrigation_model.h5) to the model folder.
def save_model(self):
        self.model.save("model/{}.h5".format(self.model_name))
However, running a TensorFlow Keras H5 model on the Wio Terminal to make predictions on the irrigation levels (classes) is not eligible and efficient considering size, latency, and power consumption.
Thus, I converted my neural network model from a TensorFlow Keras H5 model (.h5) to a TensorFlow Lite model (.tflite). Then, I modified the TensorFlow Lite model to create a C array (.h file) to run the model on the Wio Terminal successfully.
To alter the TensorFlow Lite model to a C array, I applied the hex_to_c_array function copied directly from this tutorial to the tflite_to_c_array.py file.
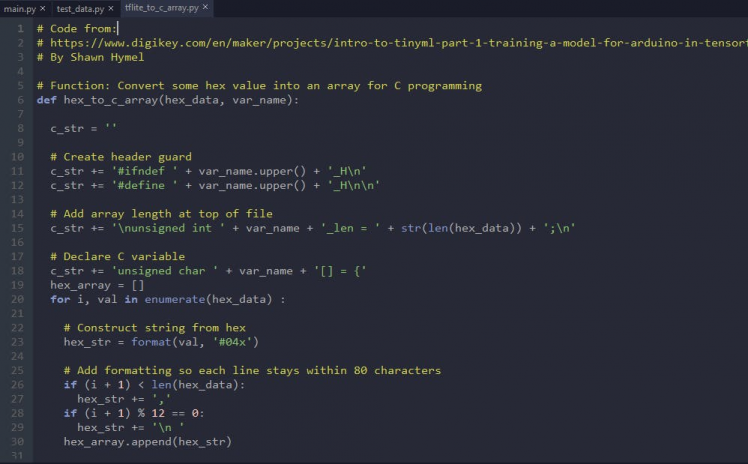
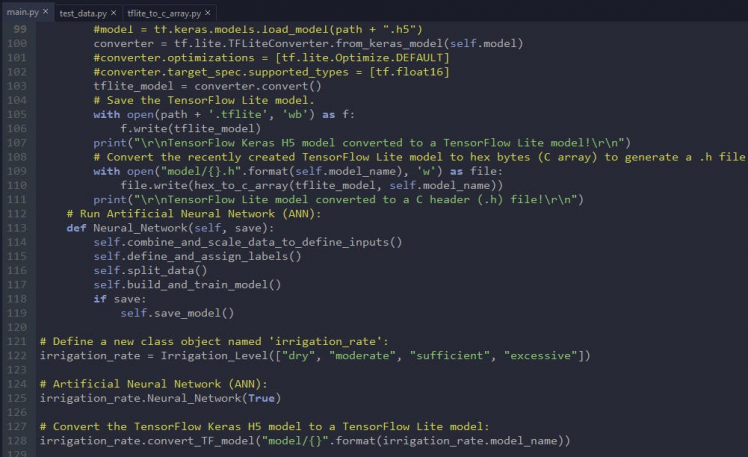
⭐ In the convert_TF_model function, convert the recently trained and evaluated model to a TensorFlow Lite model by applying the TensorFlow Lite converter (tf.lite.TFLiteConverter.from_keras_model).
⭐ Then, save the converted TensorFlow Lite model (irrigation_model.tflite) to the model folder.
⭐ Modify the recently created TensorFlow Lite model to a C array (.h file) by executing the hex_to_c_array function.
⭐ Finally, save the converted C array (irrigation_model.h) to the model folder.
def convert_TF_model(self, path):
#model = tf.keras.models.load_model(path + ".h5")
converter = tf.lite.TFLiteConverter.from_keras_model(self.model)
#converter.optimizations = [tf.lite.Optimize.DEFAULT]
#converter.target_spec.supported_types = [tf.float16]
tflite_model = converter.convert()
# Save the TensorFlow Lite model.
with open(path + '.tflite', 'wb') as f:
f.write(tflite_model)
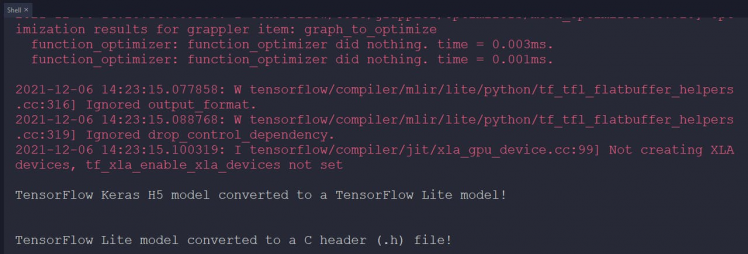
print("rnTensorFlow Keras H5 model converted to a TensorFlow Lite model!rn")
# Convert the recently created TensorFlow Lite model to hex bytes (C array) to generate a .h file string.
with open("model/{}.h".format(self.model_name), 'w') as file:
file.write(hex_to_c_array(tflite_model, self.model_name))
print("rnTensorFlow Lite model converted to a C header (.h) file!rn")
Step 6: Setting up the model on Wio Terminal
After building, training, and converting my neural network model to a C array (.h file), I needed to upload and run the model directly on the Wio Terminal so as to create an easy-to-use device without any dependencies.
Fortunately, there is an official library provided by TensorFlow to run inferences on microcontrollers with the TensorFlow Lite models converted to C arrays. Although, for now, it only supports a few development boards, including the Wio Terminal, it is a fast and efficient library for running basic neural network models on microcontrollers. Since TensorFlow Lite for Microcontrollers does not require operating system support, any standard C or C++ libraries, or dynamic memory allocation, the Wio Terminal can detect irrigation levels (classes) without needing Wi-Fi connectivity.
⭐ To download the TensorFlow Lite library on the Arduino IDE, go to Sketch ➡ Include Library ➡ Manage Libraries… and search for TensorFlow. Then, install the latest version of the Arduino_TensorFlowLite library.

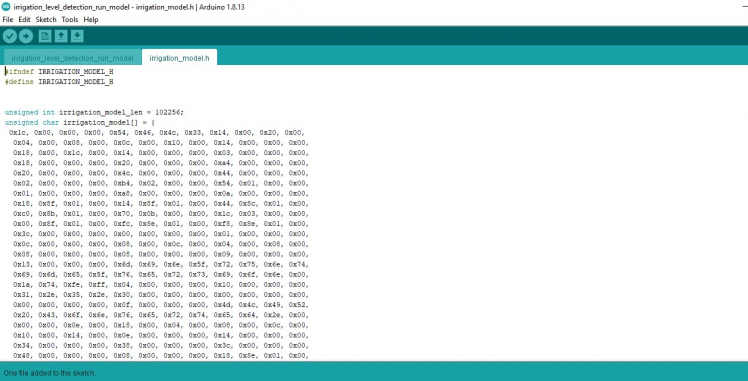
After installing the TensorFlow Lite library on the Arduino IDE, I needed to import my neural network model modified as a C array (irrigation_model.h) to run inferences.
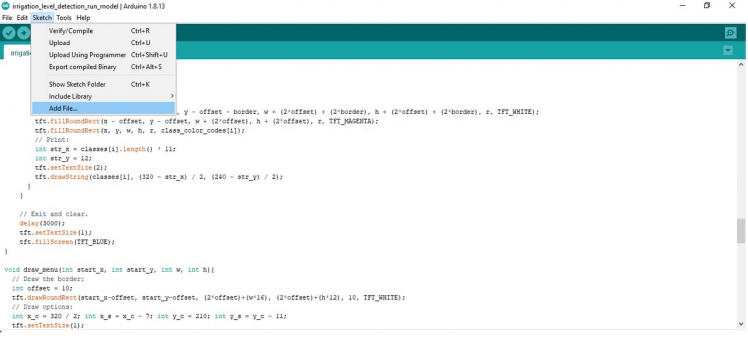
⭐ To import the converted C array (.h file), go to Sketch ➡ Add File...
After importing the converted C array (.h file) successfully to the Arduino IDE, I modified the code in this tutorial from TensorFlow to run my neural network model. I utilized the 5-way switch integrated into the Wio Terminal to run inference to detect irrigation levels (classes):
- Press ➡ Run Inference
You can download the irrigation_level_detection_run_model.ino file to try and inspect the code for running TensorFlow Lite neural network models on Wio Terminal.
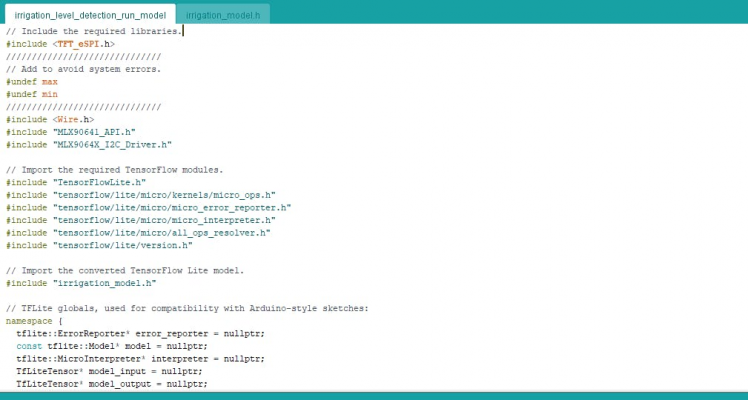
⭐ Include the required libraries.
⭐ Since the min and max functions defined for the Wio Terminal are also defined in the TensorFlow Lite library, add #undef max and #undef min to avoid compile errors.
#include <TFT_eSPI.h>
//////////////////////////////
// Add to avoid system errors.
#undef max
#undef min
//////////////////////////////
#include <Wire.h>
#include "MLX90641_API.h"
#include "MLX9064X_I2C_Driver.h"
⭐ Import the required TensorFlow modules.
#include "TensorFlowLite.h"
#include "tensorflow/lite/micro/kernels/micro_ops.h"
#include "tensorflow/lite/micro/micro_error_reporter.h"
#include "tensorflow/lite/micro/micro_interpreter.h"
#include "tensorflow/lite/micro/all_ops_resolver.h"
#include "tensorflow/lite/version.h"
⭐ Include the TensorFlow Lite model modified as a C array (.h file).
⭐ Define the TFLite globals used for compatibility with Arduino-style sketches.
⭐ Create an area of memory to use for input, output, and other TensorFlow arrays.
#include "irrigation_model.h"

// TFLite globals, used for compatibility with Arduino-style sketches:
namespace {
  tflite::ErrorReporter* error_reporter = nullptr;
  const tflite::Model* model = nullptr;
  tflite::MicroInterpreter* interpreter = nullptr;
  TfLiteTensor* model_input = nullptr;
  TfLiteTensor* model_output = nullptr;

  // Create an area of memory to use for input, output, and other TensorFlow arrays.
  constexpr int kTensorArenaSize = 15 * 1024;
  uint8_t tensor_arena[kTensorArenaSize];
} // namespace
⭐ Define the threshold value for the model outputs (results).
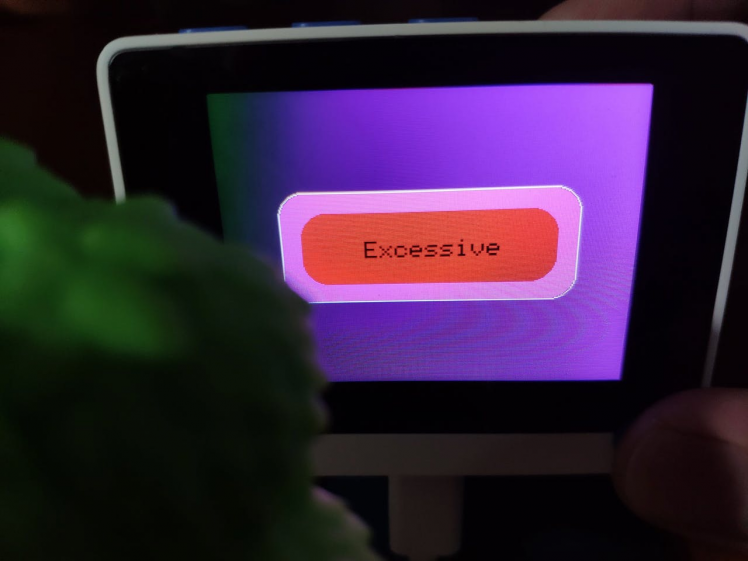
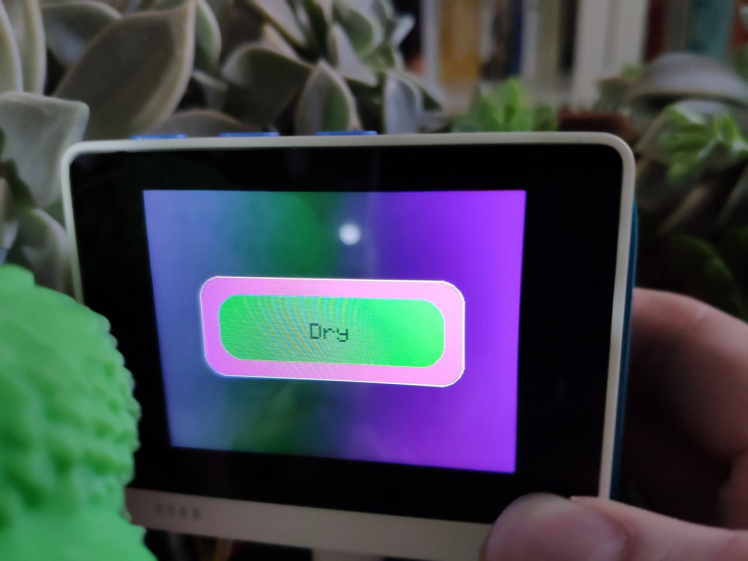
⭐ Define the irrigation level (class) names and color codes:
- Dry ➡ Green
- Moderate ➡ Greenyellow
- Sufficient ➡ Orange
- Excessive ➡ Red
float threshold = 0.75;

// Define the irrigation level (class) names and color codes:
String classes[] = {"Dry", "Moderate", "Sufficient", "Excessive"};
uint32_t class_color_codes[] = {TFT_GREEN, TFT_GREENYELLOW, TFT_ORANGE, TFT_RED};
⭐ Define the MLX90641 thermal imaging camera settings.
⭐ Define the maximum and minimum temperature values.
const byte MLX90641_address = 0x33; // Default 7-bit unshifted address of the MLX90641.
#define TA_SHIFT 12 // Default shift value for MLX90641 in the open air.
uint16_t eeMLX90641[832];
float MLX90641To[192];
uint16_t MLX90641Frame[242];
paramsMLX90641 MLX90641;
int errorno = 0;
// Define the maximum and minimum temperature values:
uint16_t MinTemp = 21;
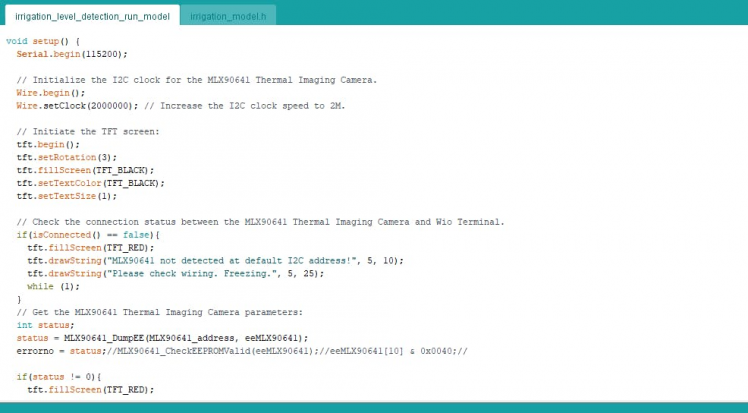
uint16_t MaxTemp = 45;⭐ Initialize the I2C clock for the MLX90641 thermal imaging camera.
Wire.begin();
  Wire.setClock(2000000); // Increase the I2C clock speed to 2M.
⭐ Initiate the TFT screen.
tft.begin();
  tft.setRotation(3);
  tft.fillScreen(TFT_BLACK);
  tft.setTextColor(TFT_BLACK);
  tft.setTextSize(1);
⭐ Check the connection status between the MLX90641 thermal imaging camera and the Wio Terminal.
if(isConnected() == false){
    tft.fillScreen(TFT_RED);
    tft.drawString("MLX90641 not detected at default I2C address!", 5, 10);
    tft.drawString("Please check wiring. Freezing.", 5, 25);
    while (1);
  }
⭐ Get the MLX90641 thermal imaging camera parameters. Once params are extracted, release the eeMLX90641 array.
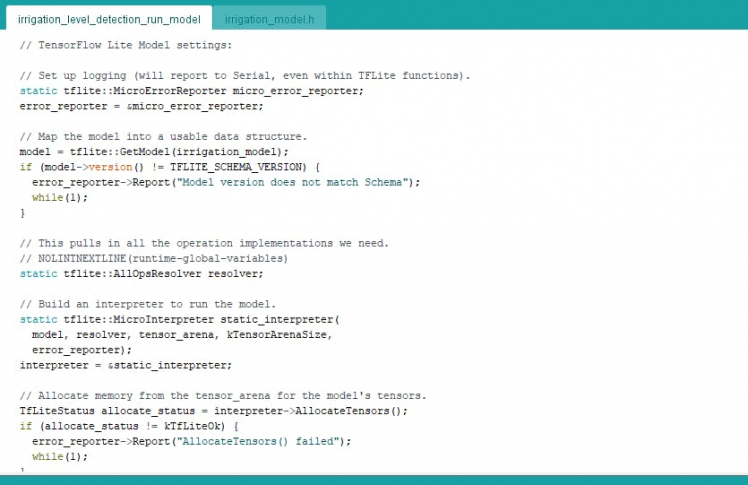
MLX90641_SetRefreshRate(MLX90641_address, 0x05); // Set rate to 16Hz.⭐ Define the TensorFlow Lite model settings:
⭐ Set up logging (will report to Serial, even within TFLite functions).
⭐ Map the model into a usable data structure.
static tflite::MicroErrorReporter micro_error_reporter;
  error_reporter = µ_error_reporter;

  // Map the model into a usable data structure.
  model = tflite::GetModel(irrigation_model);
  if (model->version() != TFLITE_SCHEMA_VERSION) {
    error_reporter->Report("Model version does not match Schema");
    while(1);
  }
⭐ Pull all the operation implementations.
⭐ Build an interpreter to run the model.
// This pulls in all the operation implementations we need.
  // NOLINTNEXTLINE(runtime-global-variables)
  static tflite::AllOpsResolver resolver;

  // Build an interpreter to run the model.
  static tflite::MicroInterpreter static_interpreter(
    model, resolver, tensor_arena, kTensorArenaSize,
    error_reporter);
  interpreter = &static_interpreter;
⭐ Allocate memory from the tensor_arena for the model's tensors.
⭐ Assign model input and output buffers (tensors) to pointers.
TfLiteStatus allocate_status = interpreter->AllocateTensors();
if (allocate_status != kTfLiteOk) {
error_reporter->Report("AllocateTensors() failed");
while(1);
}
// Assign model input and output buffers (tensors) to pointers.
model_input = interpreter->input(0);
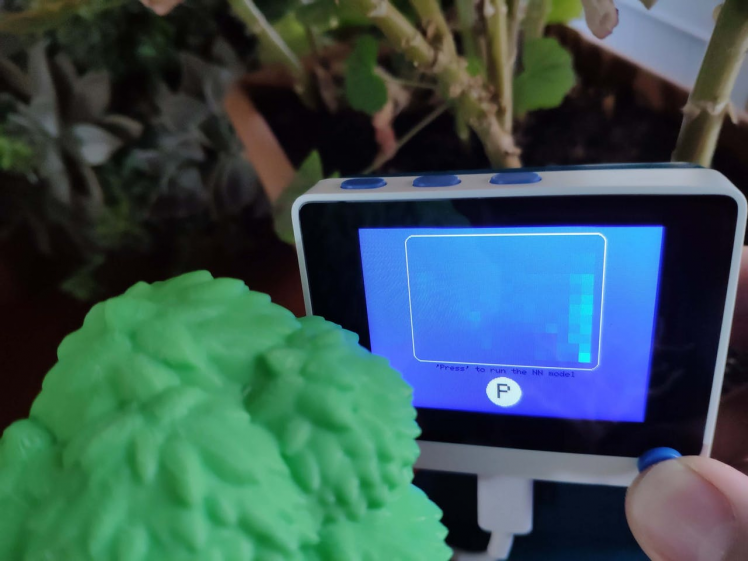
model_output = interpreter->output(0);⭐ In the draw_menu function, draw the run inference option (Press) and the border of the simple image generated from the thermal imaging array (16x12).
void draw_menu(int start_x, int start_y, int w, int h){
// Draw the border:
int offset = 10;
tft.drawRoundRect(start_x-offset, start_y-offset, (2*offset)+(w*16), (2*offset)+(h*12), 10, TFT_WHITE);
// Draw options:
int x_c = 320 / 2; int x_s = x_c - 7; int y_c = 210; int y_s = y_c - 11;
tft.setTextSize(1);
/////////////////////////////////////
tft.fillCircle(x_c, y_c, 20, TFT_WHITE);
tft.drawChar(x_s, y_s, 'P', TFT_BLACK, TFT_WHITE, 3);
tft.drawString("'Press' to run the NN model", x_c - 80, y_c - 33);
/////////////////////////////////////
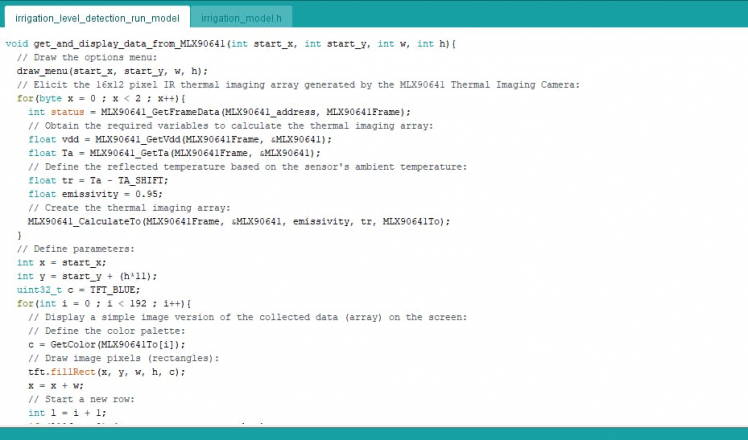
}⭐ In the get_and_display_data_from_MLX90641 function, after executing the draw_menu function, elicit the 16x12 pixel IR thermal imaging array generated by the MLX90641 thermal imaging camera:
⭐ Obtain the required variables to calculate the thermal imaging array.
⭐ Define the reflected temperature based on the sensor's ambient temperature.
⭐ Create the thermal imaging array - MLX90641To.
⭐ To display a simple image version of the recently generated thermal imaging array (16x12) on the screen, assign colors for each element (pixel) in the array by using the GetColor function.
⭐ Finally, draw each pixel (rectangle) to create a simple image version of the given thermal imaging array.
void get_and_display_data_from_MLX90641(int start_x, int start_y, int w, int h){
// Draw the options menu:
draw_menu(start_x, start_y, w, h);
// Elicit the 16x12 pixel IR thermal imaging array generated by the MLX90641 Thermal Imaging Camera:
for(byte x = 0 ; x < 2 ; x++){
int status = MLX90641_GetFrameData(MLX90641_address, MLX90641Frame);
// Obtain the required variables to calculate the thermal imaging array:
float vdd = MLX90641_GetVdd(MLX90641Frame, &MLX90641);
float Ta = MLX90641_GetTa(MLX90641Frame, &MLX90641);
// Define the reflected temperature based on the sensor's ambient temperature:
float tr = Ta - TA_SHIFT;
float emissivity = 0.95;
// Create the thermal imaging array:
MLX90641_CalculateTo(MLX90641Frame, &MLX90641, emissivity, tr, MLX90641To);
}
// Define parameters:
int x = start_x;
int y = start_y + (h*11);
uint32_t c = TFT_BLUE;
for(int i = 0 ; i < 192 ; i++){
// Display a simple image version of the collected data (array) on the screen:
// Define the color palette:
c = GetColor(MLX90641To[i]);
// Draw image pixels (rectangles):
tft.fillRect(x, y, w, h, c);
x = x + w;
// Start a new row:
int l = i + 1;
if (l%16 == 0) { x = start_x; y = y - h; }
}
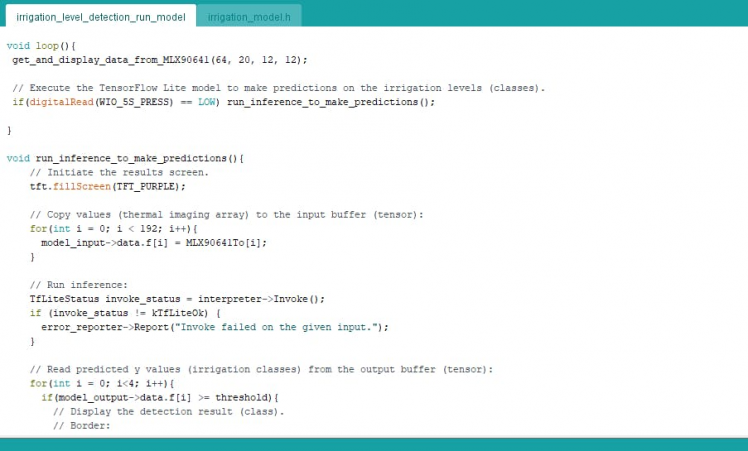
}⭐ In the run_inference_to_make_predictions function:
⭐ Initiate the results (outputs) screen.
⭐ Copy the recently generated thermal imaging array (MLX90641To) to the input buffer (tensor).
⭐ Run inference.
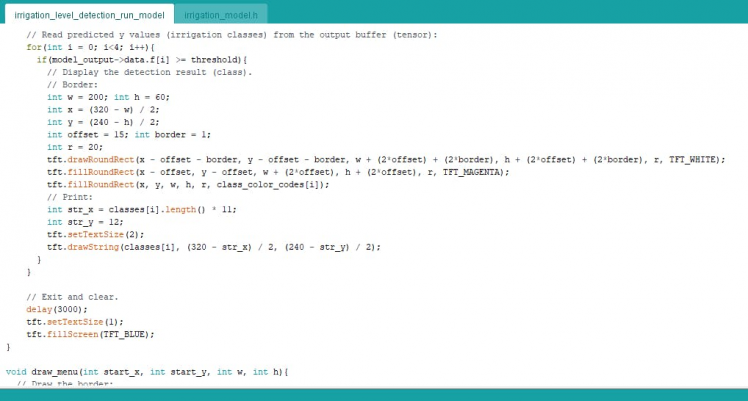
⭐ Read predicted y values (irrigation classes) from the output buffer (tensor).
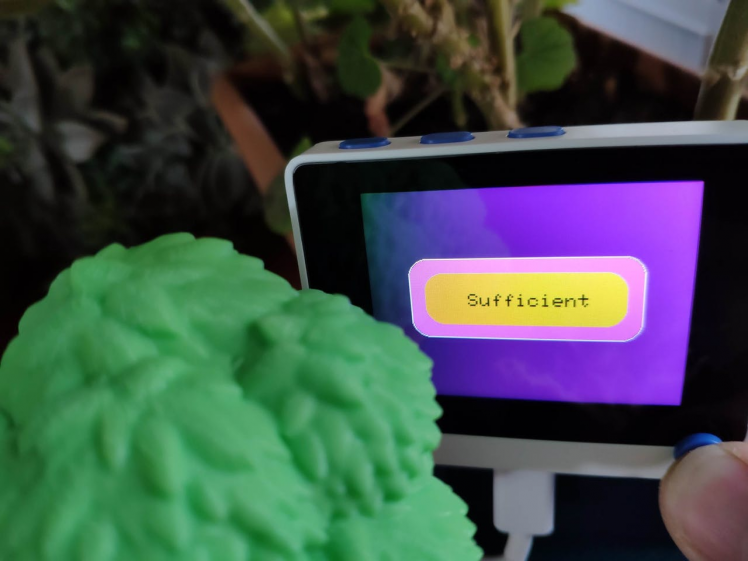
⭐ Display the detection result greater than the given threshold (0.75). It represents the most accurate label (irrigation class) predicted by the model.
void run_inference_to_make_predictions(){
    // Initiate the results screen.
    tft.fillScreen(TFT_PURPLE);

    // Copy values (thermal imaging array) to the input buffer (tensor):
    for(int i = 0; i < 192; i++){
      model_input->data.f[i] = MLX90641To[i];
    }

    // Run inference:
    TfLiteStatus invoke_status = interpreter->Invoke();
    if (invoke_status != kTfLiteOk) {
      error_reporter->Report("Invoke failed on the given input.");
    }

    // Read predicted y values (irrigation classes) from the output buffer (tensor):
    for(int i = 0; i<4; i++){
      if(model_output->data.f[i] >= threshold){
        // Display the detection result (class).
        // Border:
        int w = 200; int h = 60;
        int x = (320 - w) / 2;
        int y = (240 - h) / 2;
        int offset = 15; int border = 1;
        int r = 20;
        tft.drawRoundRect(x - offset - border, y - offset - border, w + (2*offset) + (2*border), h + (2*offset) + (2*border), r, TFT_WHITE);
        tft.fillRoundRect(x - offset, y - offset, w + (2*offset), h + (2*offset), r, TFT_MAGENTA);
        tft.fillRoundRect(x, y, w, h, r, class_color_codes[i]);
        // Print:
        int str_x = classes[i].length() * 11;
        int str_y = 12;
        tft.setTextSize(2);
        tft.drawString(classes[i], (320 - str_x) / 2, (240 - str_y) / 2);
      }
    }

    // Exit and clear.
    delay(3000);
    tft.setTextSize(1);
    tft.fillScreen(TFT_BLUE);
}
⭐ If the 5-way switch is pressed, run inference to detect irrigation levels (classes).
get_and_display_data_from_MLX90641(64, 20, 12, 12);

 // Execute the TensorFlow Lite model to make predictions on the irrigation levels (classes).
 if(digitalRead(WIO_5S_PRESS) == LOW) run_inference_to_make_predictions();
In Step 4, you can inspect GetColor and Getabcd functions in detail.
Step 7: Running the model on Wio Terminal to make predictions on the irrigation classes
My neural network model predicts possibilities of labels (irrigation classes) for each given input (thermal imaging array) as an array of 4 numbers. They represent the model's "confidence" that the given input array corresponds to each of the four different irrigation classes based on thermal imaging [0 - 3], as shown in Step 5:
- 0 — Dry
- 1 — Moderate
- 2 — Sufficient
- 3 — Excessive
After importing and setting up the model (as a C array) on the Wio Terminal successfully, I run the model to detect irrigation levels (classes) of various plants in my garden and balcony.
After executing the code for running the model on the Wio Terminal:
?? The device displays thermal imaging arrays as a real-time video stream on the screen.
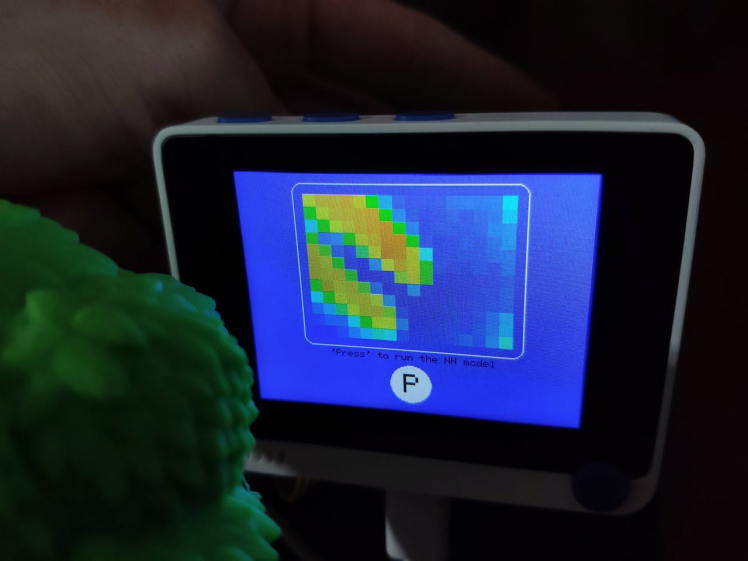
?? If the 5-way switch is pressed, the device runs inference with the model by employing the most recently generated thermal imaging array as the input array.
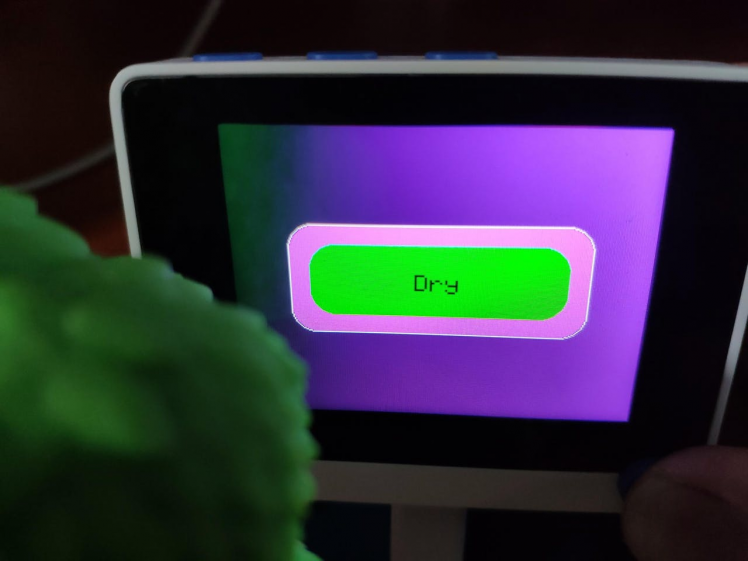
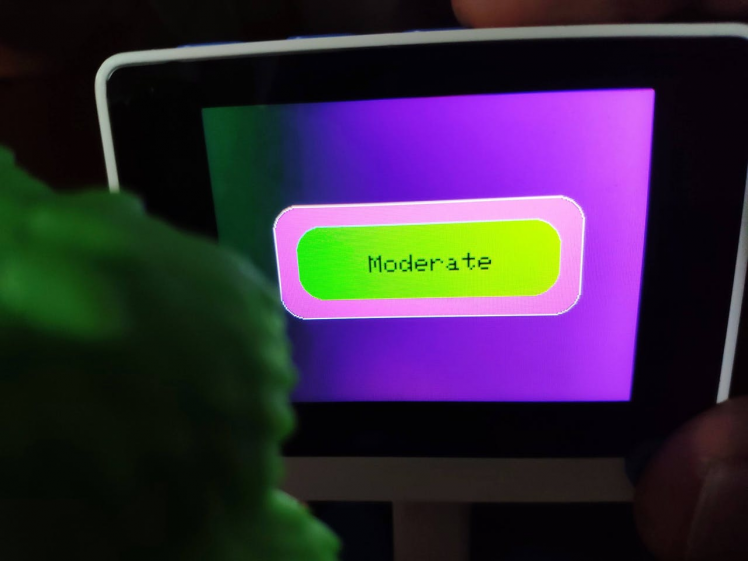
?? Then, the device displays the output, which represents the most accurate label (irrigation class) predicted by the model.
?? Each irrigation level (class) as the output has its unique color code:
- Dry ➡ Green
- Moderate ➡ Greenyellow
- Sufficient ➡ Orange
- Excessive ➡ Red

?? As far as my experiments go, the device works impeccably while detecting irrigation levels (classes) of various plants in different conditions :)


Videos and Conclusion
After completing all steps above and experimenting, I have employed the device to apply precise irrigation scheduling to my plants so as to improve water use efficiency.
Further Discussions
By applying neural network models trained on thermal imaging and sensing in agriculture, we can achieve to[3]:
?? detect seed quality earlier,
?? improve irrigation scheduling and agricultural water management,
?? detect soil salinity,
?? detect plant diseases and pathogens,
?? improve crop yield estimation,
?? assess crop maturity,
?? detect bruises and scratches on fruits and vegetables.
References
[1] I.F. García-Tejero, A.E. Rubio, I. Viñuela, A Hernández, S Gutiérrez-Gordillo, C.R. Rodríguez-Pleguezuelo, V.H. Durán-Zuazo, Thermal imaging at plant level to assess the crop-water status in almond trees (cv. Guara) under deficit irrigation strategies, Agricultural Water Management, Volume 208, 2018, Pages 176-186, ISSN 0378-3774, https://doi.org/10.1016/j.agwat.2018.06.002.
[2] Olga M. Grant, Łukasz Tronina, Hamlyn G. Jones, M. Manuela Chaves, Exploring thermal imaging variables for the detection of stress responses in grapevine under different irrigation regimes, Journal of Experimental Botany, Volume 58, Issue 4, March 2007, Pages 815–825, https://doi.org/10.1093/jxb/erl153.
[3] Roselyne Ishimwe, K. Abutaleb, F. Ahmed, Applications of Thermal Imaging in Agriculture—A Review, Advances in Remote Sensing, Volume 3, Issue 3, September 2014, Pages 128-140, http://dx.doi.org/10.4236/ars.2014.33011.
Schematics, diagrams and documents
CAD, enclosures and custom parts
Code
Credits
kutluhan_aktar
AI & Full-Stack Developer | @EdgeImpulse | @Particle | Maker | Independent Researcher
Related products


Leave your feedback...