
Fight Fire ? - Wild Fire Prediction Using Tinyml ?

Made by zainmfd / 3D Printing / Sensors / Weather / IoT
About the project
Fight Fire is a wildfire prediction device that will help the firefighting authority to respond quickly to the wildfire.
Project info
Difficulty: Expert
Platforms: Microsoft, Seeed Studio, Edge Impulse, Helium, MQTT, Node-RED
Estimated time: 2 days
License: MIT license (MIT)
Items used in this project
Hardware components

View all
Software apps and online services
|
|
Soldering Station, 110 V | |
|
|
Microsoft VS Code | |
|
|
Solidworks | |
|
|
Node-RED | |
|
|
MQTT | |
|
|
Google Colab | |
|
|
Edge Impulse Studio | |
|
|
Arduino IDE |
View all
Story
2020 has been a year like no other. COVID-19 is a truly global event with social and economic implications that will change the world forever. As the international community focuses its attention on fighting the pandemic, another crisis is unfolding around the world.
? src: giphy.com/gifs/fires-australia-wildifires-Pjsh1SlQ4KnT9MP6JH

? src: giphy.com/gifs/fires-australia-wildifires-Pjsh1SlQ4KnT9MP6JH
This one is taking place in forests, where the latest fire seasons have been raging with unprecedented ferocity, from the Amazon to the Arctic: in April 2020, the number of fire alerts across the globe was up by 13% compared to last year – which was already a record year for fires. Persistent hotter and drier weather due to climate change, and other human factors such as land conversion for agriculture and poor forest management are the main drivers behind the increase. It is estimated that humans are responsible for around 75% of all wildfires, 2 and much of the increase in fire incidents during 2020 can be directly linked to human actions. This means solutions are in our grasp too. There’s no magic bullet that will fix the issue overnight, but there are ways forward if behaviours of the past are changed. (?src: https://wwf.panda.org)
? src: https://wwf.panda.org/

? src: https://wwf.panda.org/
THE ISSUE ⚠️Wildfires affect all biomes, from forests and savannahs to grasslands and tundra.
? src: https://wwf.panda.org/

? src: https://wwf.panda.org/
Based on records from 2000-2015, 85% of the surface area burned globally each year is located in tropical savannahs, which make up 19% of total land cover. Even though forests make up only 10% of the total area burned, their higher carbon storage capacity means that they are responsible for one-quarter of all fire-related carbon dioxide emissions. Forest fires in all biomes are responsible for nearly a quarter of all emissions from fires. Tropical forests are less resilient to fire, and their carbon storage contribution makes them an urgent priority for preventative action.. (?src: https://wwf.panda.org/)
? src: wwfeu.awsassets.panda.org

? src: wwfeu.awsassets.panda.org
CHANGING CLIMATE, WORSENING TRENDS ⚠️The carbon released into the atmosphere by fires further increases global heating, and the vicious circle gets worse. This establishes a positive feedback loop that amplifies the role of extreme hot dry weather in generating more frequent intense fires that in turn generate increased forest carbon emissions.
? src: https://wwf.panda.org/

? src: https://wwf.panda.org/
SURFACE BURNED ?
The area of land burned globally has actually been steadily declining since it started to be recorded in 1900, and in this century (2000-2016) the annual area burned has averaged 3.4 million km2 or just over 2% of the global land surface. (?src:https://wwf.panda.org/)
FREQUENCY ?
Fire seasons are getting longer, and extreme fire seasons are more common. From 1979 to 2013, the global fire season length increased by 19% on average. This increase is particularly severe in east Africa and Brazil, with the forests and savannahs of South America experiencing an average of over one month increase in the fire season.. (?src:https://wwf.panda.org/)
SEVERITY ✨
The impact of fires on ecosystems varies. Light fires may only burn ground vegetation, leaving a thin layer of ash and sometimes acting as a positive regenerative force. But increasing global temperatures and more frequent rain-free days are causing a decline in moisture from the soil to treetops, meaning fires are burning much more severely and causing greater damage to humans and nature alike. (?src:https://wwf.panda.org/)
THE CONSEQUENCES ⚠️Globally, fires emit carbon dioxide emissions equivalent to the European Union every year. Their contribution to the climate crisis alone would be more than enough of a reason for the global community to treat their increase as a major threat. But that’s not all: wildfires also have severe consequences for human health and wellbeing, biodiversity, and economies around the world.
HEALTH AND WELLBEING ❤️?
In terms of direct fatalities, wildfires appear less dangerous than many other disasters. While they kill between 100-400 people each year, 55 represented only 0.2% of deaths from natural hazards over the last two decades (earthquakes, by comparison, are responsible for more than 50%). (?src:https://wwf.panda.org/)
INDONESIA’S FIRE SEASON LED TO THE CLOSURE OF SCHOOLS AND AFFECTED MORE THAN 5 MILLION STUDENTSare more
BIODIVERSITY ?
The increasing frequency and severity of wildfires pose a growing threat to biodiversity globally.
26 NATIVE AUSTRALIAN SPECIES WERE PUSHED CLOSER TO EXTINCTION AS MORE THAN 30% OF THEIR HABITAT WAS BURNT
ECONOMIC LOSSES
The economic costs of wildfires are going up all over the world as fires increase in frequency and severity. On an individual level, fires drastically worsen living conditions, and this has economic consequences: in the US property values decrease from 10-20% in areas affected by wildfires. (?src:https://wwf.panda.org/)
NEXT STEPS – URGENT ACTION ? - The SOLUTION (Current)The best way to prevent a wildfire is to create precautions to avoid the wildfire. There are many ways to do the prevention, like controller fire throw the dry land..etc
- Obey local laws regarding open fires, including campfires.
- Keep all flammable objects away from fire. Scrape away leaves, twigs, and grass within a 10-foot diameter circle from fire.
- Have firefighting tools nearby and handy.
- Never leave a fire unattended.
- Carefully dispose of hot charcoal.
- Drown all fires.
- Carefully extinguish smoking materials.
These are the generic precaution listed under the Department of Energy and Environmental Protection.
And another major Prevention method for wildfire is Firebreak.
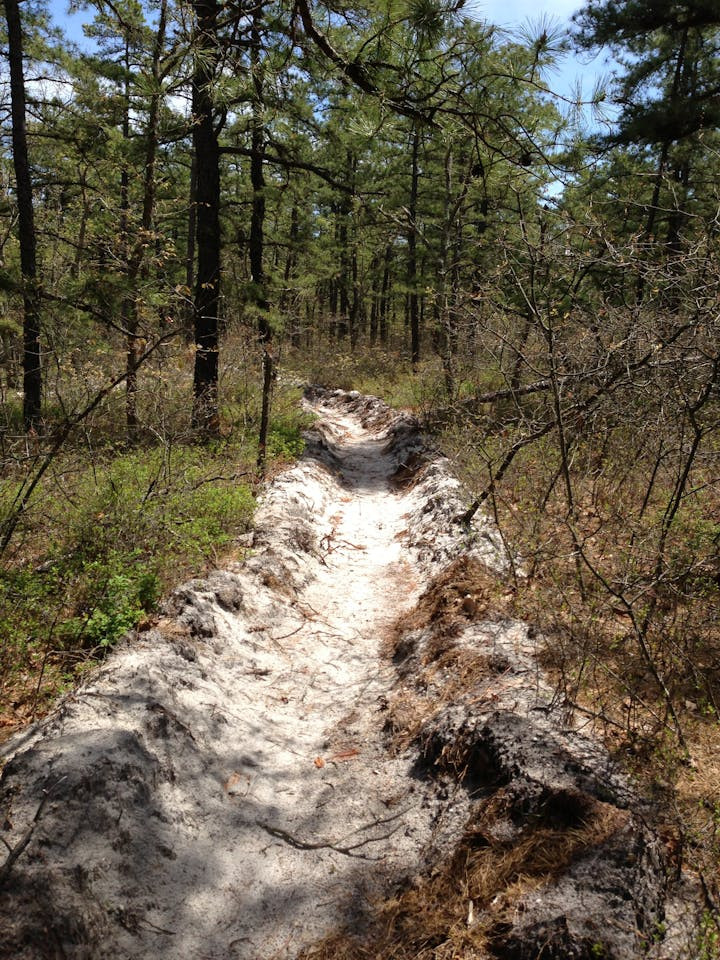
Firebreak is a gap in vegetation or other combustible material that acts as a barrier to slow or stop the progress of a bushfire or wildfire. A firebreak may occur naturally where there is a lack of vegetation or "fuel", such as ina river, lake, or canyon. Firebreaks may also be man-made, and many of these also serve as roads, such as logging roads, four-wheel drive trails, secondary roads, or highways.
Satellites are used for wildfire monitoring.NASA’s satellite instruments are often the first to detect wildfires burning in remote regions, and the locations of new fires are sent directly to land managers worldwide within hours of the satellite overpass. Together, NASA instruments, including a number built and managed by NASA’s Jet Propulsion Laboratory in Pasadena, California, detect actively burning fires, track the transport of smoke from fires, provide information for fire management, and map the extent of changes to ecosystems, based on the extent and severity of burn scars. Monitoring system Source
De-merits of existing solution ?
- Most of the existing solutions will alert after the burning of woods, this will kill lots of animals and plants, and this leads to the extinction of animals and plants.
- Most of the Solutions can only retrieve coordinates of the affected area and can't help in the rescue mission.
- All the existing systems can't identify the weather condition of the land area before the origin of the fire.
Evacuation of leaving beings in hazardous areas will be a major complication.
Proposed solution ? - Fight Fire ? - Predict the Wild Fire. PredictFight Fire is a wildfire prediction device that will allow the local fire fighting authority to respond quickly to the wildfire. We know that wildfire is due to the climatic change in the forest, based on this we monitor the weather condition of the forest using various sensors and record the dramatic increase in atmospheric temperature, decrease in soil moisture, and changes in atmospheric pressure. Source: ? https://www.c2es.org/content/wildfires-and-climate-change/#.
Fight Fire nodes are fixed in afire-prone areas, and by utilizing the mesh network of the node, the firefighting authority can plan for fire prevention. At the same time node identify the presence of humans and animals in a hazardous area.
The Architecture ?
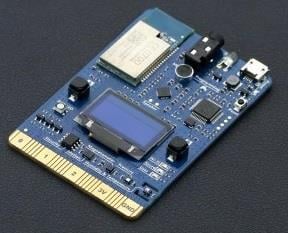
To predict the wildfire, we are using various sensors to collect the data and that feed to SeeedStudio Wio Terminal and using the TinyML platform called Edge Impluse, Creating the ML model and Inferencing on the Wio Terminal to predict the Wild Fire Chance in a particular time. Once the Fight Fire Node is able to predict the chance of Fire, It immediately shares information with the nearest forest ranger and local authorities through the Helium LoRa WAN and MQTT Technologies.
Architecture - Fight Fire ? v1.0

Architecture - Fight Fire ? v1.0
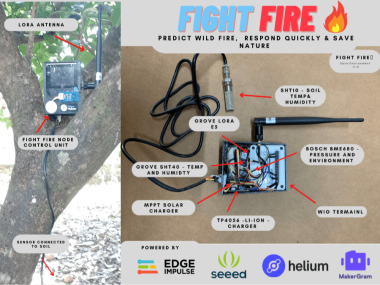
In Fight Fire - We are using SHT10 Soil Temperature and SoilHumidity sensor, BOSCH BME680 Pressure, and Environment sensor, and Grove SHT40 Temp and Humidity Sensor to gather the data and then we use Grove E5 LoRa module to send data to the nearest helium gateways and the from the helium gateways we are routing the information to the nearest ranger or local authorities to make actions and decisions. The Fight Fire nodes are standalone with Solar and 18650 Li-ion batteries.
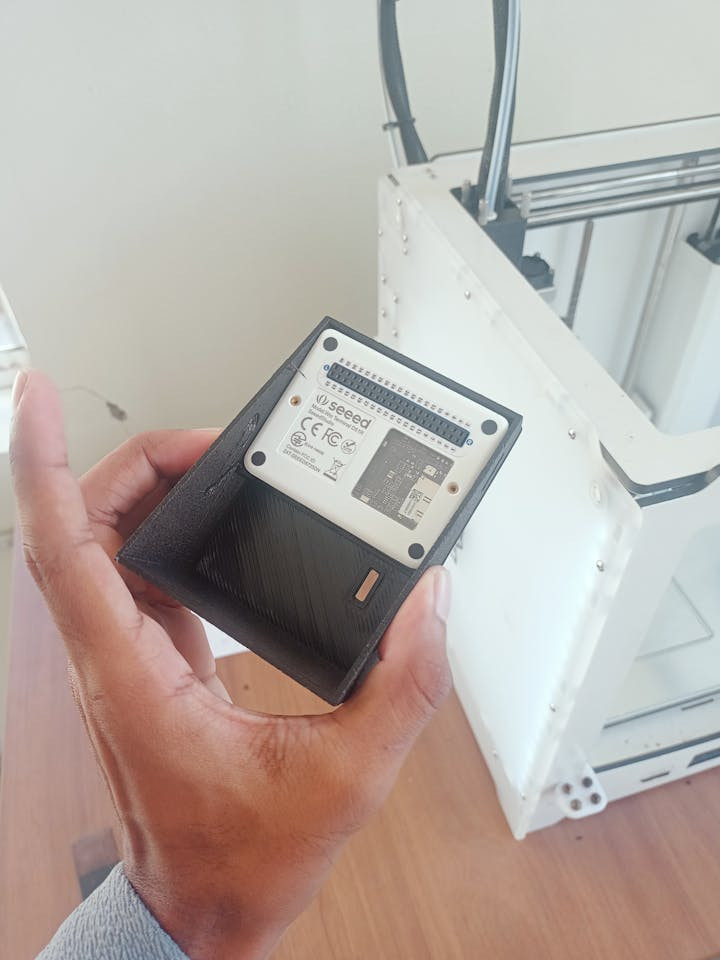
Fight Fire ? - Hardware Compontents

Fight Fire ? - Hardware Compontents
TinyML - The Tiny Brain ?Machine learning (ML) is a way of writing computer programs. Specifically, it’s a way of writing programs that process raw data and turn it into information that is meaningful at an application level.
For example, one ML program might be designed to determine when an industrial machine has broken down based on readings from its various sensors so that it can alert the operator. Another ML program might take raw audio data from a microphone and determine if a word has been spoken, so it can activate a smart home device.
Recent advances in microprocessor architecture and algorithm design have made it possible to run sophisticated machine learning workloads on even the smallest of microcontrollers. Embedded machine learning, also known as TinyML, is the field of machine learning when applied to embedded systems such as these. ( ?:https://docs.edgeimpulse.com/docs/what-is-embedded-machine-learning-anyway )
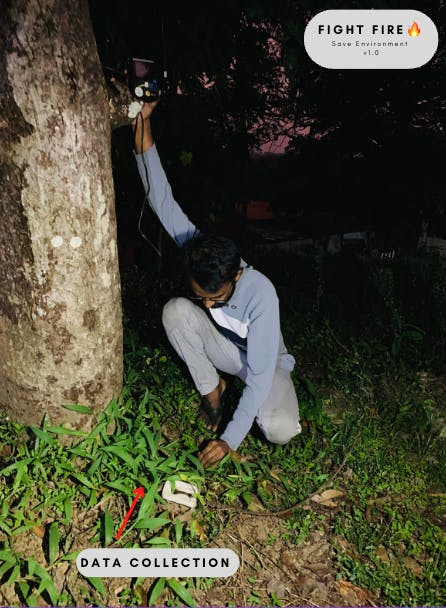
Machine Learning Step :1 Data Collection ?
To predict an event like wildfire, we need to have plenty of data to feed to the machine learning system to create an accurate model.
DATA, DATA.....

DATA, DATA.....
I connected all the sensors to the Wio terminal and upload a program that can read all the sensor data and that can print all the raw data. code for data collection.
#include <Wire.h>
#include <SHT1x.h>
#include <SensirionI2CSht4x.h>
#define BTN_START           0                         // 1: press button to start, 0: loop
#define BTN_PIN             WIO_5S_PRESS              // Pin that button is connected to
#define SAMPLING_FREQ_HZ    4                         // Sampling frequency (Hz)
#define SAMPLING_PERIOD_MS  1000 / SAMPLING_FREQ_HZ   // Sampling period (ms)
#define NUM_SAMPLES         8                         // 8 samples at 4 Hz is 2 seconds
#define dataPin 6
#define clockPin 8
SHT1x sht1x(dataPin, clockPin);
SensirionI2CSht4x sht4x;

void setup() {
  pinMode(BTN_PIN, INPUT_PULLUP);
  Serial.begin(115200);
  while (!Serial) {
    delay(100);
  }
  Wire.begin();
  uint16_t error;
  char errorMessage[256];
  sht4x.begin(Wire);
  uint32_t serialNumber;
}

void loop() {
  uint16_t error;
  unsigned long timestamp;
  char errorMessage[256];

  float soil_temp;
  float soil_humidity;
  float temperature;
  float humidity;

  // Read values from the sensor
  error = sht4x.measureHighPrecision(temperature, humidity);
  soil_temp = sht1x.readTemperatureC();
  soil_humidity = sht1x.readHumidity();


#if BTN_START
  while (digitalRead(BTN_PIN) == 1);
#endif

  // Print header
  Serial.println("timestamp,soiltemp,soilhum,atmtemp,atmhum");

  // Transmit samples over serial port
  for (int i = 0; i < NUM_SAMPLES; i++) {

    // Take timestamp so we can hit our target frequency
    timestamp = millis();

    // Print CSV data with timestamp
    Serial.print(timestamp);
    Serial.print(",");
    Serial.print(soil_temp);
    Serial.print(",");
    Serial.print(soil_humidity);
    Serial.print(",");
    Serial.print(temperature);
    Serial.print(",");
    Serial.print(humidity);
    Serial.println();

    // Wait just long enough for our sampling period
    while (millis() < timestamp + SAMPLING_PERIOD_MS);
  }

  // Print empty line to transmit termination of recording
  Serial.println();

  // Make sure the button has been released for a few milliseconds
#if BTN_START
  while (digitalRead(BTN_PIN) == 0);
  delay(100);
#endif
}
Then we need to create CSV file from this for that I refer to Artificial AI Nose by ShawnHymel. In his documentation, he wrote a python script to create CSV from the serial data. Code for creating CSV from the serial data. After this connect the Fight Fire node with the all required sensor and set itfor data collection.
To run the script we need to connect our sensor with the laptop and we want to note the Serial port, After identifying the serial port write the code below in terminal inside VS CODE. In my case to collect the data into CVS I type
python serial_data.py -p COM8 -b 115200 -d soiltemp_atmtemp -l chance_for_fireAfter running the about comment we can see like below
Commend to runf the python sctipt and data collection

Commend to runf the python sctipt and data collection
We Collect all the required data set then we can see the samples below
Collected data

Collected data
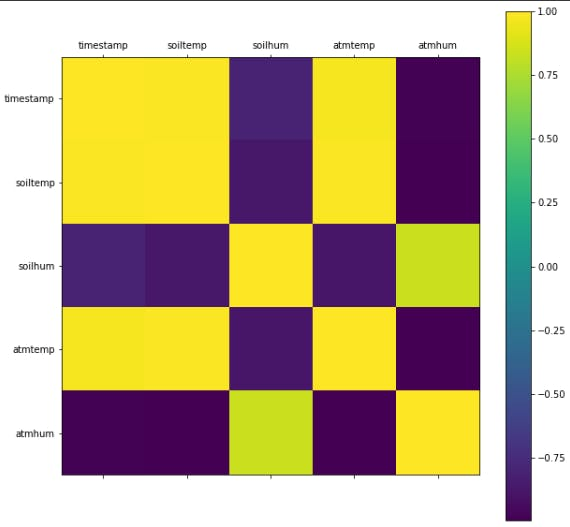
After collecting the data corresponding to all conditions (normal and chance_for_fire) we need to perform feature scaling on the collected data. For this, I refer to the same Artificial AI Nose. in there there is a google colab notebook.
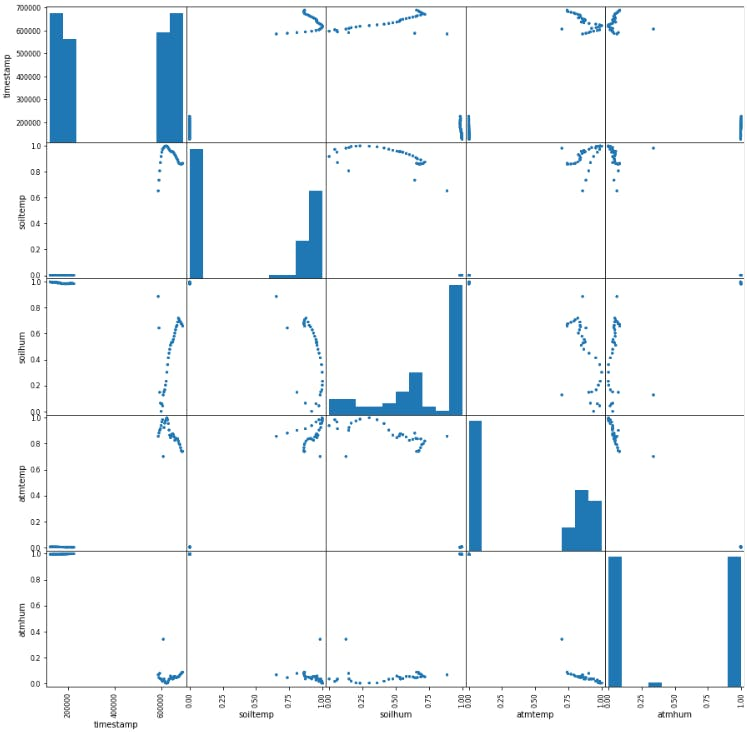
We need to upload all our data into a folder in the google collab, then we need to run that code. Before normalization, we get a large variation in the signal like below.
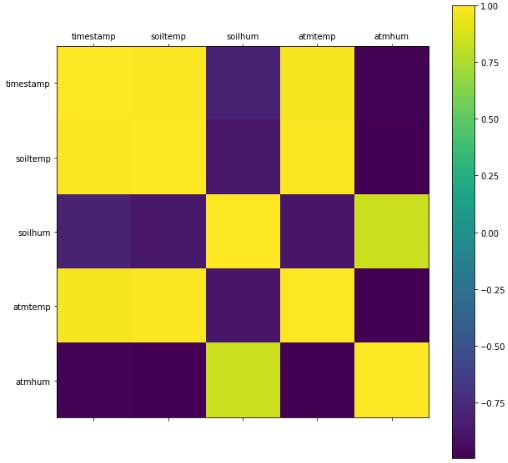
Plot scatter matrix to look for correlation(before normalisation)
")
Plot scatter matrix to look for correlation(before normalisation)
Histograms of all the data

Histograms of all the data
After this, we need to make a small edit in the program according to our sensor like below.
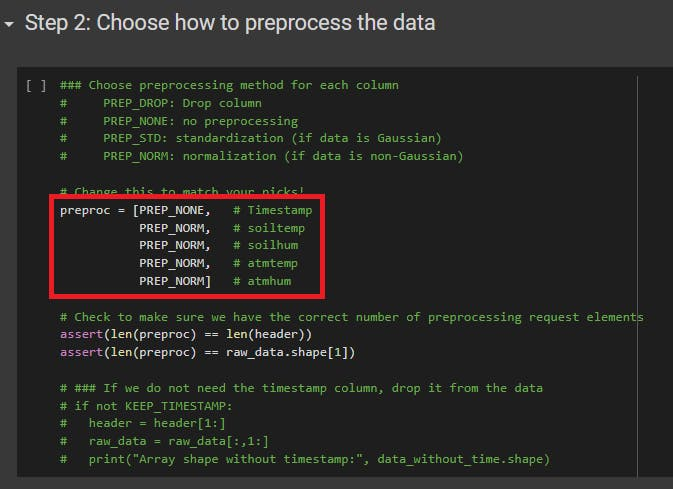
In the next step, this will generate the required parameters like mean range standard deviation etc..
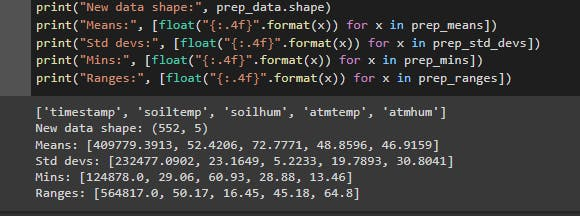
Now I can get the normalized data Plot scatter matrix and in this data, all the values will be in the range of 0 to 1.
After this, I can get the all data into a zip file and it will be downloaded. Now I can extract the zip data file.
Next is the model training part, for this, I use the edge impulse platform after creating a project and goto todata acquisition and upload data.

then chose all the CSV inside the extracted zip file
Required action while data uploading

Required action while data uploading
After completing the data upload we can see all the uploaded data in a plot
Data of dry ,that means Chance_of_fire

Data of dry ,that means Chance_of_fire
Also, I collect another label that is called normal
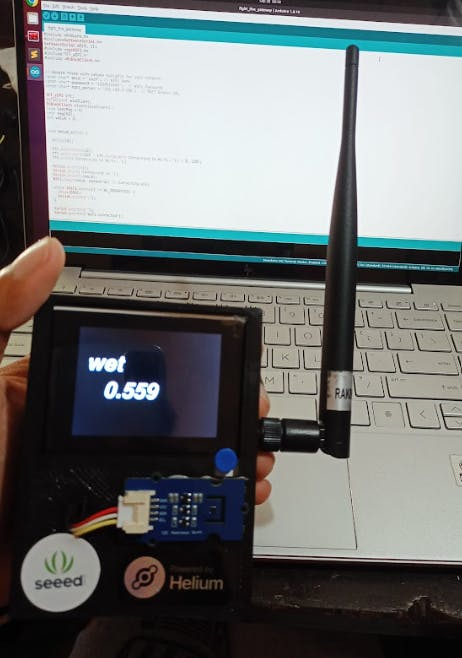
Wet dat this will be the normal atmosphric condition

Wet dat this will be the normal atmosphric condition
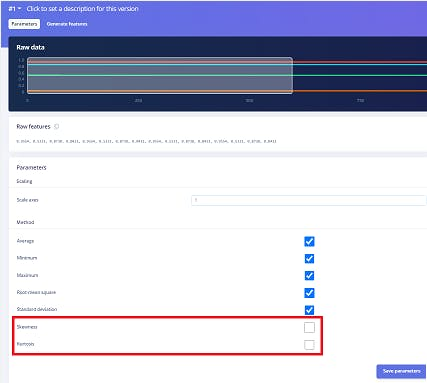
After data collection, the next step is to create impulse or impulse designing. In here we are choosing all the recommended blocks for the processing, Also change the Window size, Window increase, and Frequency (Hz). and the add processing block and learning block and save the impulse.
Impulse design

Impulse design
In Flatten, I uncheck both Skewness and Kurtosis in the parameters (this was suggested by the referred documentation). then click on Save parameters
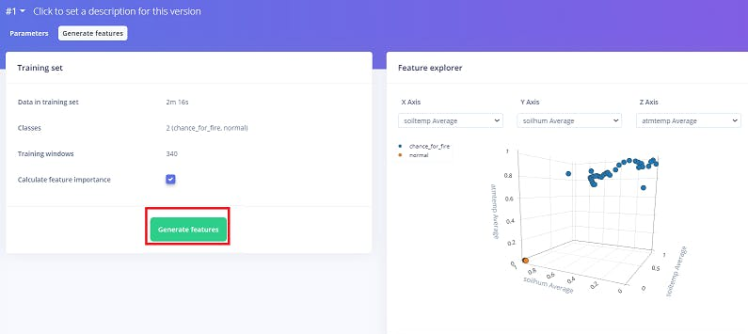
After this, I want to generate features. For this click on Generate Features, Also I can see the generated features on the right side too.
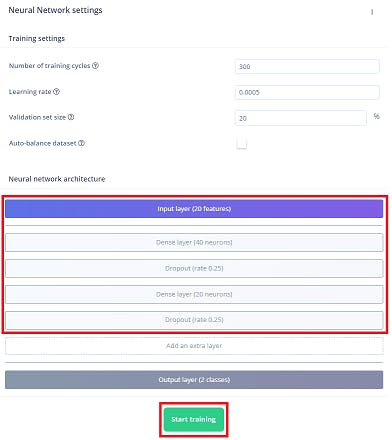
The next step is the most crucial step to train the TinyML model, for that click on NN Classifier from the left side and I need to make some changes in the neural network architecture.Change the first layer neural network to 40 neurons and 20 neurons in the second layer. Also, I add a dropout layer with a dropout rate of 0.25 after each Dense layer. Change the training cycles to 300. then Click Start training.
After a few minutes, the training is completed and the Confusion matrix and Data explorer will be generated.
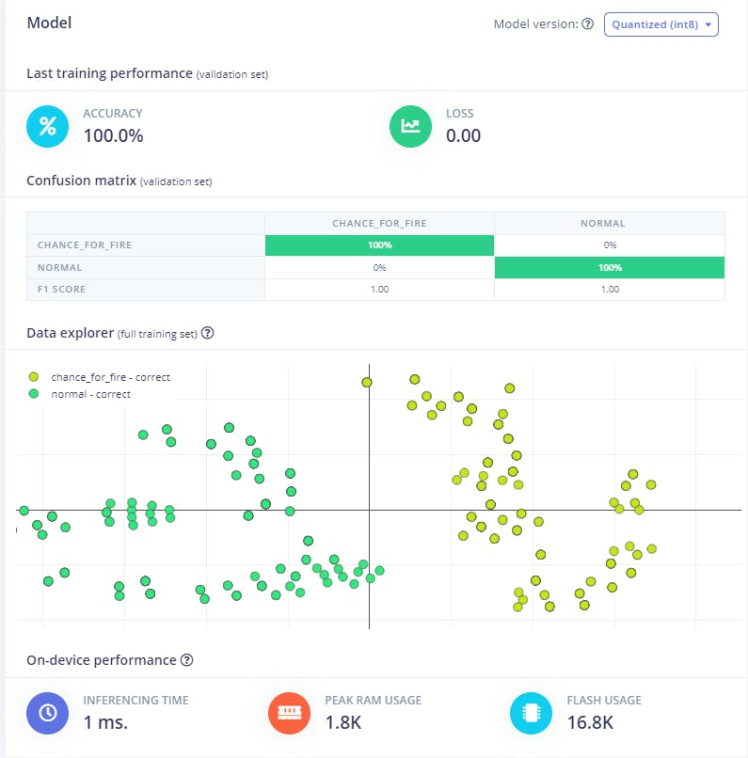
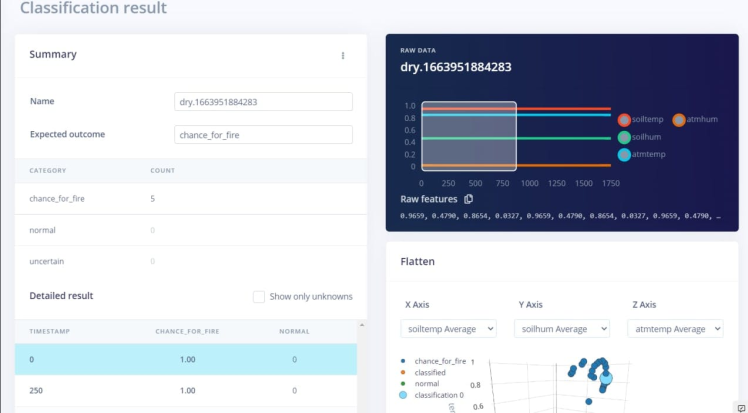
After completing the above step we get an F1 score of 1 in both cases, next I move on to live classification for evaluation of the trained model. For this, I collect a new dataset for testing and tested it like below.
And here comes the end of the training finally go to deployment and click for Arduino library.
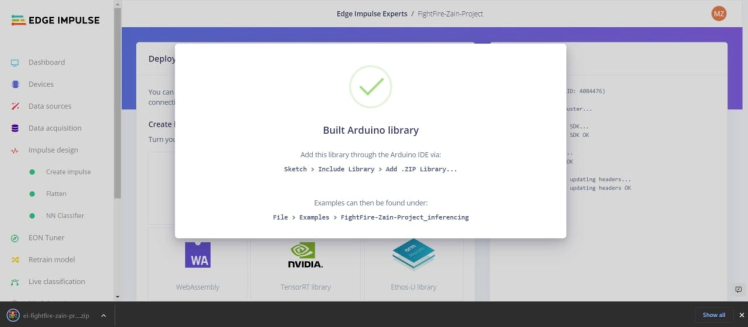
Arduino library of the trained model
Now I want to add this library into Arduino libraries in the usual manner Sketch > Include Library > Add.ZIP Library. At the top of the drop-down list, select the option to "Add.ZIP Library'' select our library and add it.
Now is the time to set up the Node, For this, we need to combine classifier code with the data collection code also we need to include code for LoRa communication too. I connect the LoRa E5 into D1 and D0 using Software serial and connect the other sensor through the I2C communication port. Code for Node.
#include <SHT1x.h>
#include <Wire.h>
#include "TFT_eSPI.h"
#include <SensirionI2CSht4x.h>
#include "FightFire-Zain-Project_inferencing.h"

#include <Arduino.h>
#include<SoftwareSerial.h>
SoftwareSerial e5(0, 1);
static char recv_buf[512];
int counter = 0;
static int at_send_check_response(char *p_ack, int timeout_ms, char *p_cmd, ...)
{
  int ch;
  int num = 0;
  int index = 0;
  int startMillis = 0;
  va_list args;
  memset(recv_buf, 0, sizeof(recv_buf));
  va_start(args, p_cmd);
  e5.print(p_cmd);
  Serial.print(p_cmd);
  va_end(args);
  delay(200);
  startMillis = millis();
  if (p_ack == NULL)
    return 0;
  do
  {
    while (e5.available() > 0)
    {
      ch = e5.read();
      recv_buf[index++] = ch;
      Serial.print((char)ch);
      delay(2);
    }
    if (strstr(recv_buf, p_ack) != NULL)
      return 1;
  }
  while (millis() - startMillis < timeout_ms);
  Serial.println();
  return 0;
}

#define dataPin 6
#define clockPin 8
SHT1x sht1x(dataPin, clockPin);
SensirionI2CSht4x sht4x;

// Settings
#define DEBUG               1                         // 1 to print out debugging info
#define DEBUG_NN            false                     // Print out EI debugging info
#define ANOMALY_THRESHOLD   0.3                       // Scores above this are an "anomaly"
#define SAMPLING_FREQ_HZ    4                         // Sampling frequency (Hz)
#define SAMPLING_PERIOD_MS  1000 / SAMPLING_FREQ_HZ   // Sampling period (ms)
#define NUM_SAMPLES         EI_CLASSIFIER_RAW_SAMPLE_COUNT  // 4 samples at 4 Hz
#define READINGS_PER_SAMPLE EI_CLASSIFIER_RAW_SAMPLES_PER_FRAME // 8

// Preprocessing constants (drop the timestamp column)
float mins[] = {
  29.06, 60.93, 28.88, 13.46
};
float ranges[] = {
  50.17, 16.45, 45.18, 64.8
};

TFT_eSPI tft;   // Wio Terminal LCD

void setup() {
  // Start serial
  Serial.begin(9600);
  e5.begin(9600);
  Serial.print("E5 LOCAL TESTrn");
  at_send_check_response("+TEST: RFCFG", 1000, "AT+TEST=RFCFG,866,SF12,125,12,15,14,ON,OFF,OFFrn");
  delay(200);
  Wire.begin();
  uint16_t error;
  char errorMessage[256];

  sht4x.begin(Wire);

  // Configure LCD
  tft.begin();
  tft.setRotation(3);
  tft.setFreeFont(&FreeSansBoldOblique24pt7b);
  tft.fillScreen(TFT_BLACK);
}

void loop() {
  uint16_t error;
  unsigned long timestamp;
  char errorMessage[256];
  static float raw_buf[NUM_SAMPLES * READINGS_PER_SAMPLE];
  static signal_t signal;
  float temp;
  int max_idx = 0;
  float max_val = 0.0;
  char str_buf[40];
  // Collect samples and perform inference
  for (int i = 0; i < NUM_SAMPLES; i++) {

    // Take timestamp so we can hit our target frequency
    timestamp = millis();

    float soil_temp;
    float soil_humidity;
    float atmtemp;
    float atmhum;
    error = sht4x.measureHighPrecision(atmtemp, atmhum);
    // Read values from the sensor
    soil_temp = sht1x.readTemperatureC();
    soil_humidity = sht1x.readHumidity();


    // Store raw data into the buffer
    raw_buf[(i * READINGS_PER_SAMPLE) + 0] = soil_temp;
    raw_buf[(i * READINGS_PER_SAMPLE) + 1] = soil_humidity;
    raw_buf[(i * READINGS_PER_SAMPLE) + 2] = atmtemp;
    raw_buf[(i * READINGS_PER_SAMPLE) + 3] = atmhum;

    // Perform preprocessing step (normalization) on all readings in the sample
    for (int j = 0; j < READINGS_PER_SAMPLE; j++) {
      temp = raw_buf[(i * READINGS_PER_SAMPLE) + j] - mins[j];
      raw_buf[(i * READINGS_PER_SAMPLE) + j] = temp / ranges[j];
    }

    // Wait just long enough for our sampling period
    while (millis() < timestamp + SAMPLING_PERIOD_MS);
  }

  // Print out our preprocessed, raw buffer
#if DEBUG
  for (int i = 0; i < NUM_SAMPLES * READINGS_PER_SAMPLE; i++) {
    Serial.print(raw_buf[i]);
    if (i < (NUM_SAMPLES * READINGS_PER_SAMPLE) - 1) {
      Serial.print(", ");
    }
  }
  Serial.println();
#endif

  // Turn the raw buffer in a signal which we can the classify
  int err = numpy::signal_from_buffer(raw_buf, EI_CLASSIFIER_DSP_INPUT_FRAME_SIZE, &signal);
  if (err != 0) {
    ei_printf("ERROR: Failed to create signal from buffer (%d)rn", err);
    return;
  }

  // Run inference
  ei_impulse_result_t result = {0};
  err = run_classifier(&signal, &result, DEBUG_NN);
  if (err != EI_IMPULSE_OK) {
    ei_printf("ERROR: Failed to run classifier (%d)rn", err);
    return;
  }


  for (int i = 0; i < EI_CLASSIFIER_LABEL_COUNT; i++) {
    ei_printf("t%s: %.3frn", result.classification[i].label, result.classification[i].value);
  }


  // Find maximum prediction
  for (int i = 0; i < EI_CLASSIFIER_LABEL_COUNT; i++) {
    if (result.classification[i].value > max_val) {
      max_val = result.classification[i].value;
      max_idx = i;
    }
  }
  tft.fillScreen(TFT_BLACK);
  tft.drawString(result.classification[max_idx].label, 20, 60);
  sprintf(str_buf, "%.3f", max_val);
  tft.drawString(str_buf, 60, 120);


  String fire_status = result.classification[max_idx].label;
  if (fire_status == "dry")
  {
    Serial.println("fire detected");
    char cmd[128];
    int x=1;
    sprintf(cmd, "AT+TEST=TXLRSTR,"%d"rn", x);
      int ret = at_send_check_response("TX DONE", 5000, cmd);
  if (ret == 1)
  {
    Serial.print("Sent successfully!rn");
  }
  else
  {
    Serial.print("Send failed!rn");
  }
  }
  else {
    Serial.println("no fire");

  }

}
Then I complete a CAD model in SolidWorks and also assembled it to see the final aesthetics
CAD Model

CAD Model
Assembling stages ?1 / 4
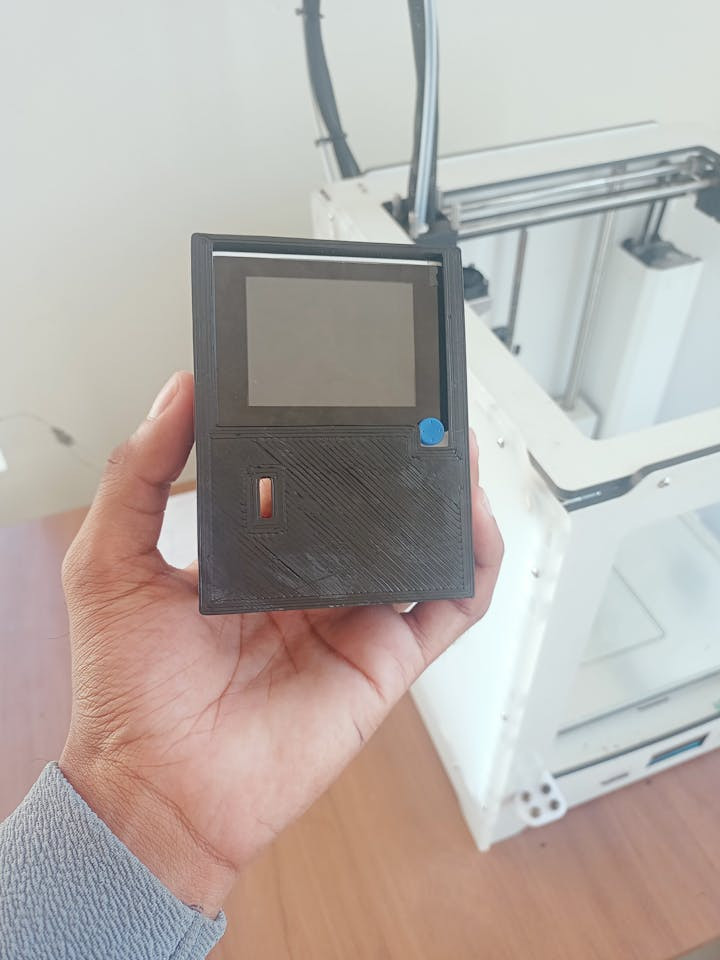
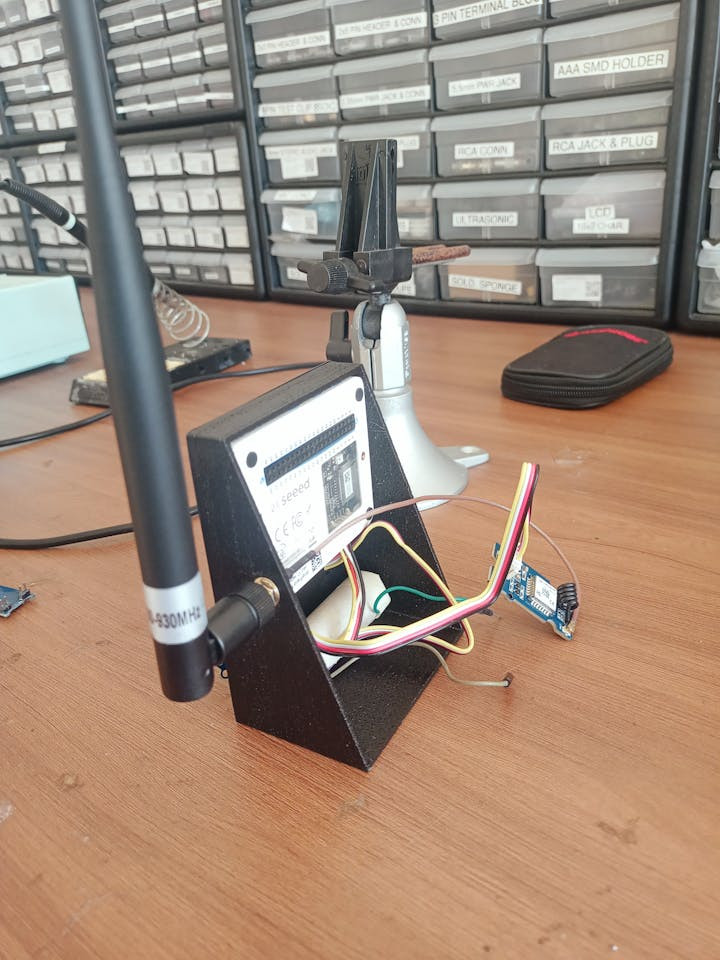

Assembly
After all the assembly, I upload the code and it started working also it gives a result in the serial monitor.
Result in node

Result in node
Testing ?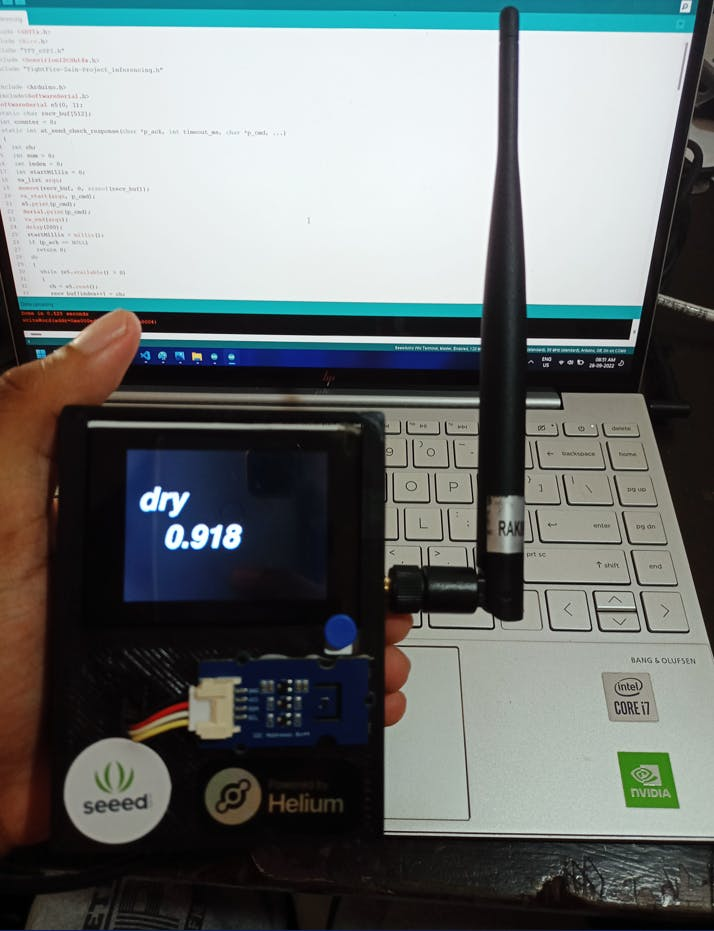
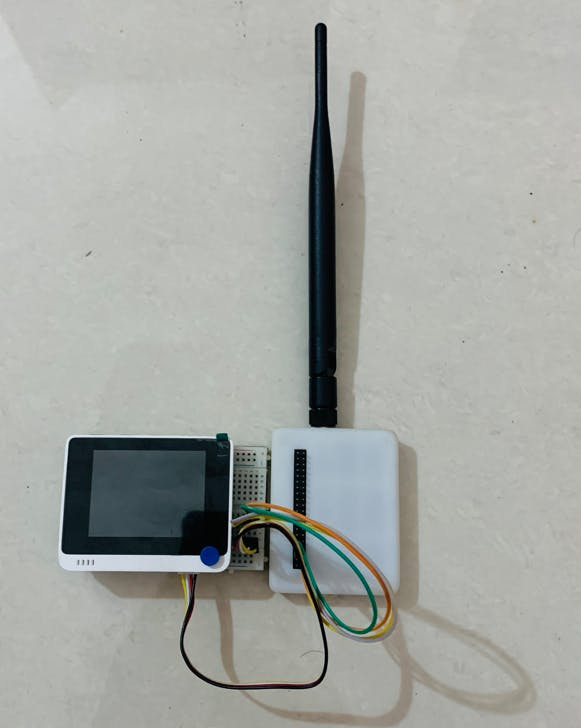
When comes to gateway setup I connect their terminal LoRa chassis to the D1 and D0 pins of the Wip terminal. also, this gateway is capable of publishing the data or the condition of forest land into the NodeRED using the MQTT protocol.
#include <Arduino.h>
#include<SoftwareSerial.h>
SoftwareSerial e5(0, 1);
#include <rpcWiFi.h>
#include"TFT_eSPI.h"
#include <PubSubClient.h>
// Update these with values suitable for your network.
const char* ssid = "*****"; // WiFi Name
const char* password = "******"; // WiFi Password
const char* mqtt_server = "*******"; // MQTT Broker URL
TFT_eSPI tft;
WiFiClient wioClient;
PubSubClient client(wioClient);
long lastMsg = 0;
char msg[50];
int value = 0;
void setup_wifi() {
delay(10);
tft.setTextSize(2);
tft.setCursor((320 - tft.textWidth("Connecting to Wi-Fi..")) / 2, 120);
tft.print("Connecting to Wi-Fi..");
Serial.println();
Serial.print("Connecting to ");
Serial.println(ssid);
WiFi.begin(ssid, password); // Connecting WiFi
while (WiFi.status() != WL_CONNECTED) {
delay(500);
Serial.print(".");
}
Serial.println("");
Serial.println("WiFi connected");
tft.fillScreen(TFT_BLACK);
tft.setCursor((320 - tft.textWidth("Connected!")) / 2, 120);
tft.print("Connected!");
Serial.println("IP address: ");
Serial.println(WiFi.localIP()); // Display Local IP Address
}
void callback(char* topic, byte* payload, unsigned int length) {
//tft.fillScreen(TFT_BLACK);
Serial.print("Message arrived [");
Serial.print(topic);
Serial.print("] ");
char buff_p[length];
for (int i = 0; i < length; i++) {
Serial.print((char)payload[i]);
buff_p[i] = (char)payload[i];
}
Serial.println();
buff_p[length] = '�';
String msg_p = String(buff_p);
tft.fillScreen(TFT_BLACK);
tft.setCursor((320 - tft.textWidth("MQTT Message")) / 2, 90);
tft.print("MQTT Message: " );
tft.setCursor((320 - tft.textWidth(msg_p)) / 2, 120);
tft.print(msg_p); // Print receved payload
}
void reconnect() {
// Loop until we're reconnected
while (!client.connected()) {
Serial.print("Attempting MQTT connection...");
// Create a random client ID
String clientId = "WioTerminal-";
clientId += String(random(0xffff), HEX);
// Attempt to connect
if (client.connect(clientId.c_str())) {
Serial.println("connected");
// Once connected, publish an announcement...
client.publish("WTout", "hello world");
// ... and resubscribe
client.subscribe("WTin");
} else {
Serial.print("failed, rc=");
Serial.print(client.state());
Serial.println(" try again in 5 seconds");
// Wait 5 seconds before retrying
delay(5000);
}
}
}
static char recv_buf[512];
static bool is_exist = false;
static int at_send_check_response(char *p_ack, int timeout_ms, char *p_cmd, ...)
{
int ch = 0;
int index = 0;
int startMillis = 0;
va_list args;
memset(recv_buf, 0, sizeof(recv_buf));
va_start(args, p_cmd);
e5.printf(p_cmd, args);
Serial.printf(p_cmd, args);
va_end(args);
delay(200);
startMillis = millis();
if (p_ack == NULL)
{
return 0;
}
do
{
while (e5.available() > 0)
{
ch = e5.read();
recv_buf[index++] = ch;
Serial.print((char)ch);
delay(2);
}
if (strstr(recv_buf, p_ack) != NULL)
{
return 1;
}
} while (millis() - startMillis < timeout_ms);
return 0;
}
static int recv_prase(void)
{
char ch;
int index = 0;
memset(recv_buf, 0, sizeof(recv_buf));
while (e5.available() > 0)
{
ch = e5.read();
recv_buf[index++] = ch;
Serial.print((char)ch);
delay(2);
}
if (index)
{
char *p_start = NULL;
char data[32] = {
0,
};
int rssi = 0;
int snr = 0;
p_start = strstr(recv_buf, "RSSI:");
if (p_start && (1 == sscanf(p_start, "RSSI:%d,", &rssi)))
p_start = strstr(recv_buf, "SNR:");
return 1;
}
return 0;
}
static int node_recv(uint32_t timeout_ms)
{
at_send_check_response("+TEST: RXLRPKT", 1000, "AT+TEST=RXLRPKTrn");
int startMillis = millis();
do
{
if (recv_prase())
{
return 1;
}
} while (millis() - startMillis < timeout_ms);
return 0;
}
void setup(void)
{
Serial.begin(115200);
// while (!Serial);
e5.begin(9600);
Serial.print("Receiverrn");
if (at_send_check_response("+AT: OK", 100, "ATrn"))
{
is_exist = true;
at_send_check_response("+MODE: TEST", 1000, "AT+MODE=TESTrn");
at_send_check_response("+TEST: RFCFG", 1000, "AT+TEST=RFCFG,866,SF12,125,12,15,14,ON,OFF,OFFrn");
delay(500);
}
else
{
is_exist = false;
Serial.print("No E5 module found.rn");
}
tft.begin();
tft.fillScreen(TFT_BLACK);
tft.setRotation(3);
Serial.println();
setup_wifi();
client.setServer(mqtt_server, 1883); // Connect the MQTT Server
client.setCallback(callback);
}
void loop(void)
{
if (is_exist)
{
node_recv(2000);
}
delay(6000);
if (!client.connected()) {
reconnect();
}
client.loop();
long now = millis();
if (now - lastMsg > 2000) {
lastMsg = now;
++value;
snprintf (msg, 50, "Wio Terminal #%ld", value);
Serial.print("Publish message: ");
Serial.println(msg);
client.publish("WTout", msg);
}
}After this deploy this in nodered by using MQTT protocol
In gateway serial monitor

In gateway serial monitor
I published the status of the forest in the nodered
- Alerting the Forest ranger officers with the Node ID
- Add Vision AI for measuring Biomass and detecting the presence of humans and animals (This is not done because my Grove Vision AI camera have some technical issue)
- Generating a map for forest ranger officers to respond quickly to the Chances of fire.
Reference ?: https://wwfeu.awsassets.panda.org/downloads/wwf_fires_forests_and_the_future_report.pdf
Schematics, diagrams and documents
CAD, enclosures and custom parts
Code
Credits
Related products


Leave your feedback...