
Condition Based Maintenance Of Dc Motor

Made by Tai-Min / 3D Printing / Artificial intelligence / Sensors / IoT
About the project
Use Thingy:91 to detect vibrations and classify them to detect different types of hard to spot motor defects.
Project info
Difficulty: Easy
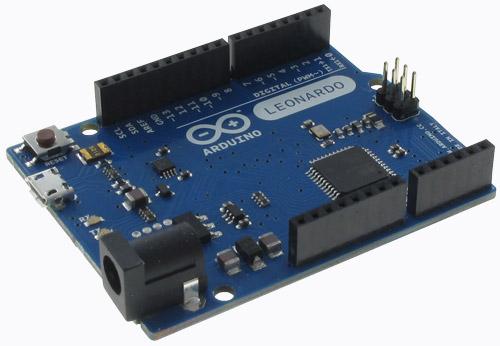
Platforms: Arduino, Nordic Semiconductor
Estimated time: 6 hours
License: MIT license (MIT)
Items used in this project
Hardware components


View all
Story
Introduction
There is no city without power, and most power comes from mechanical generators that generate our so beloved electricity by converting other forms of energy, such as heat from coal / nuclear fusion or from wind. Sadly, as with every mechanical device, these generators tend to wear or even break seemingly in random times and due to unknown reasons.
Malfunctioning generator powering a part of the city might cause a wide range of issues, from minor like causing some flickering in residential areas, to major such as stopping expensive production in industrial parts of the city causing losses in millions or even causing loss of lives due to power loss during prolonged surgeries in affected hospitals.
Of course there are ways to minimize effects of power loss, such as emergency UPS or backup generators, but these should be treated as last line of defense.
To make sure that generators will work as expected for years to come, a maintenance should be performed to check for defects such as broken bearings, faulty magnets, misalinged shaft or loose connectors.
There are two main ways to perform maintenance: periodically and based on condition.
Periodical maintenance uses some well defined metrics, in example MTTF (Mean Time To Failure) to establish how much time at most should pass since previous maintenance until next one should be performed. This method, while widely used in the industry, has some significant flaws. Firstly, there is no certainty that fault won't occur between maintenances as components don't break on schedule and even new just replaced parts can have some hidden defects. Secondly, a lot of unnecessary waste might be generated due to replacements made "just in case", even when old components are totally fine.
Condition based maintenance and monitoring uses a bunch of additional sensors (encoders, light sensors, vibration sensors) and some math to continuously check, whether device is working as expected. There are two big downsides of this method: the requirement of additional hardware, microcontrollers, sensors, etc along with place to mount them and the necessity to create and fine tune unique monitoring pipelines for every type of monitored device. While above downsides show the big effort required to set up this type of maintenance, this effort is required only once and after it's done, the upsides greatly exceed the downsides. Due to the constant monitoring, it's possible to spot even tiny anomalies in working generators (like bearing wear), before defect occurs, making it easier to react in advance. This also produces overall less unnecessary waste and ensures higher reliability and work culture.
General Concept
The main idea behind this project was to create simple proof of concept remote IoT vibration sensor that, instead of sending raw vibration data, will perform defect detection on the edge. In case of any deviation from expected conditions, the sensor will perform generator's state classification and inform the technicial staff over LTE about any abnormalities. In example, this could allow to remorely watch an array of wind turbines and perform maintenance only when needed, saving human resources.
To design and test said sensor, a simple Arduino based test bench was created that was used to drive tested generator (high power DC motor), it's artificial load (second motor connected shaft to shaft with tested one) and additional components that will simulate various defects that can happen in the generator.
The designed sensor and test bench are two separate entities that don't share any electrical connections. This means that the sensor could be attached to existing devices (analog or black box) without any significant changes in them.
Test Bench
The test bench acts as mock for real power generator. The main part of it is a strong DC motor (motor is basically generator in reverse) whose's vibration are measured and classified. Other attached components provide a way to control it and simulate various defects that can happen in real power generator.
Functionality
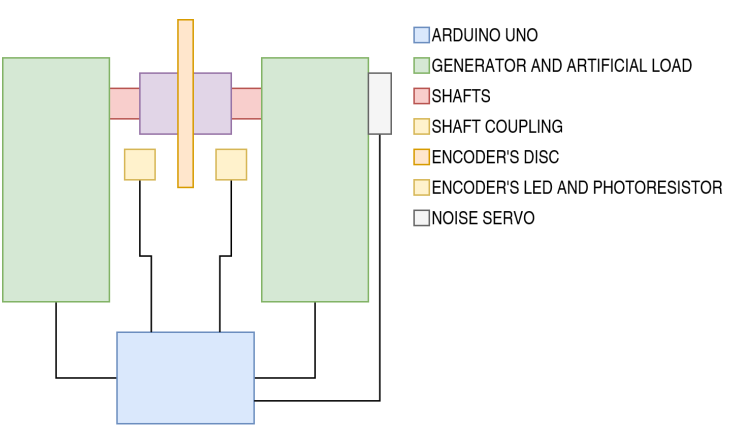
The main functionality of this mock is to generate different types of vibration to simulate defects in clean and controlled environment. As mentioned above, the main part of it is a DC motor (called generator onwards). This generator is connected electrically to Arduino UNO board through Monster Motor Shield. The Arduino can control the motor by issuing PWM and direction signals to rotate the shaft in -50 to 50 rpm range.
The shaft of the motor is connected to another motor with the same specs. This motor (called artificial load onwards) disturbs the generator motor by adding force that affects it's behavior. It will be used to simulate stalled shaft and faulty bearing defects. It will also act as artificial load to apply some torque to correctly behaving generator.
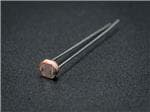
To simulate broken bearing, a simple optical encoder was added to the shaft, which will synchronize bearing's shock pulses with rotation speed of the shaft.
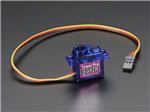
Last part of the bench is simple weak servo motor whose's vibrations will act as whitenoise. Below you can see basic schematic of the test bench:
Physical Design
The physical design of the test bench is pretty simple. There is one 24V power supply stepped down to 16V and 5V. 16V is connected to Monster Moto Shield and is used to drive both generator and artificial load. 5V powers all logic in the test bench. After power part of the schematic comes Arduino UNO with Monster Moto Shield attached. It's used to control the simulation. After the controller you can see all mentioned in "Functionality" part sensors and actuators: two DC motors as generator and artificial load, noise generating servo and led / photoresistor pair for optical encoder. Below you can see whole schematic of the test bench:
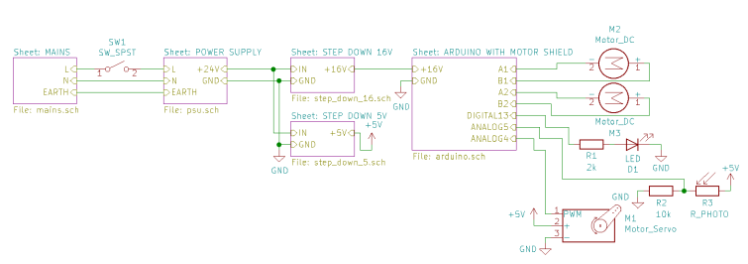
The Arduino communicates with PC through Serial and well known by industrial instruments Modbus protocol, which I've implemented for Arduino for uni project back in the time.
Firstly I had an idea to fabricate simple PCB / Shield with a bunch of buttons and pots to fine control whole simulation using Arduino's I/O, but then I asked myself: what if I would like to add some functionality or change some existing one? Why should I limit myself to single physical desing, when I have the power of microcontroller and PC by my side? And after all it was valid decision as I've changed test bench's functionality multiple times.
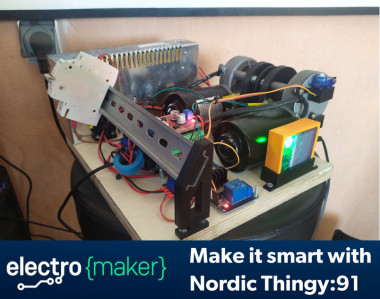
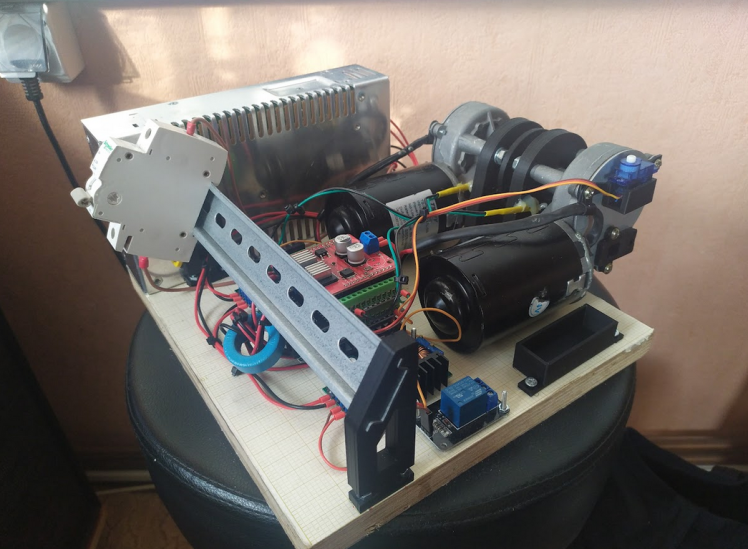
Below you can see assembled bench. DIN rail in front was supposed to hold the button / pot PCB.
Control Application
When it comes to the application there is nothing fancy to be honest. It was written in Python using PyQt5 as GUI and PyModbus as a Modbus client:
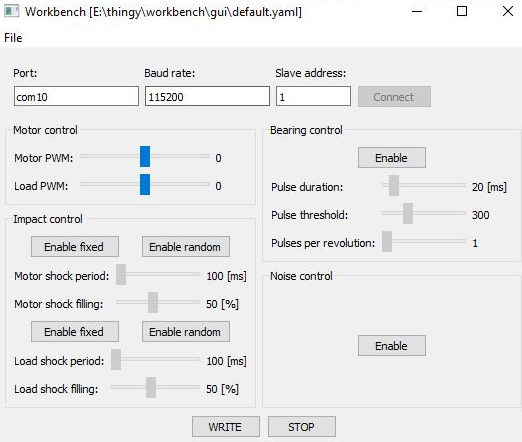
"Motor control" contains sliders to set base speed of both motors.
"Impact control" controls hammering like effect (fast on / off switching) it allows to set the period of the effect as well as it's filling (like 10% on, 90% off etc), randomized period and filling are also possible. This effect is not synchronized to speed of the shaft and it's job is to generate shaft stall / uneven load effect on the sensor (different / randomized frequency responses).
"Bearing control" is used to control faulty bearing defect. Basically, the effect generates simple small shock (increased PWM a little) on the generator that simulates unalignment of the inner structure of the bearing (like wore off bearing balls). It is synchronized to speed of the motor and can be set to 1 - 8 shocks per rotation.
"Noise control" turns on or off random servo movements that act as source of vibration noise.
The neat part of this application is the ability to save and load GUI's config using simple YAML files, so there is no need to set desired scenario by hand each time the app is launched.
Thingy Defect Detector
While designing the vibration classifier I wanted to met some design criteria. Firstly, I don't treat the sensor as a battery powered device. Given it's purpose, which is defect detection in in mechanical power generators, I have assumed that there should be some power source and battery will be used as a backup during power outages. Secondly, the device should be mounted in as non invasive manner as possible. This means no additional electricial connections to power generating system. Thirdly, the device should be transparent for other parts of the power plant. Fourthly, it should be able to signal it's state on the plant, using built in RGB led as well as remotely, using LTE. Fifthly, it should perform as much computations on the edge as it can and communicate with outside world using as less data as possible.
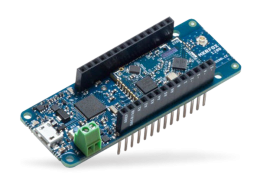
Signal Acquisition
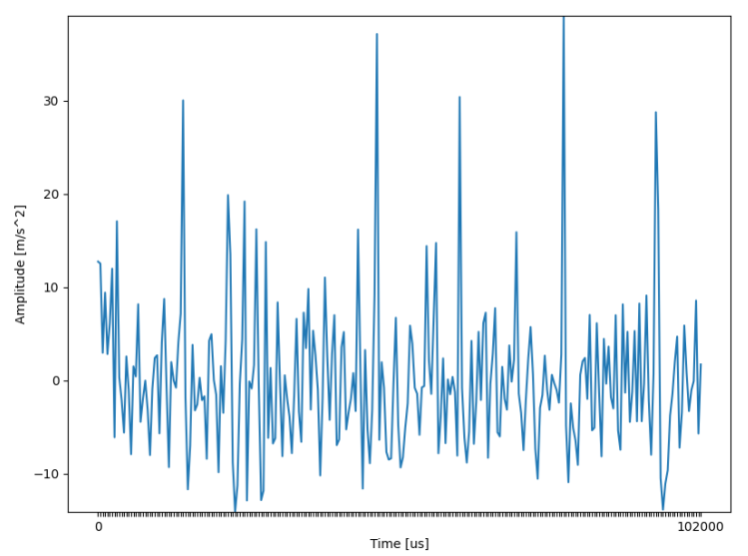
To measure vibration I've selected built in ADXL372 High G accelerometer, which could be used out of the box as Zephyr OS has ready to use drivers available for it. The measurement is performed once every 400us, which means sampling frequency of around 2.5kHz. The data is in form of 3D acceleration without sign (abs).
- struct sensor_value vals[3];
- if (sensor_sample_fetch(accel) < 0)
- {
- printf("%s fetch error!n", name);
- return false;
- }
- if (sensor_channel_get(accel, SENSOR_CHAN_ACCEL_X, &vals[ACCEL_X_IDX]) < 0)
- {
- printf("%s's X get errorn", name);
- return false;
- }
- if (sensor_channel_get(accel, SENSOR_CHAN_ACCEL_Y, &vals[ACCEL_Y_IDX]) < 0)
- {
- printf("%s's Y get errorn", name);
- return false;
- }
- if (sensor_channel_get(accel, SENSOR_CHAN_ACCEL_Z, &vals[ACCEL_Z_IDX]) < 0)
- {
- printf("%s's Z get errorn", name);
- return false;
- }
- buf[ACCEL_X_IDX][sample_idx] = fabs(sensor_value_to_double(&vals[ACCEL_X_IDX])) * 1000;
- buf[ACCEL_Y_IDX][sample_idx] = fabs(sensor_value_to_double(&vals[ACCEL_Y_IDX])) * 1000;
- buf[ACCEL_Z_IDX][sample_idx] = fabs(sensor_value_to_double(&vals[ACCEL_Z_IDX])) * 1000;
For classification task I've used window of 256 3D samples. After one classification pipeline this windows moves by 128 samples, which means that 128 samples from previous measurement and 128 brand new samples each time classification is performed.
- for (uint8_t i = 0; i < ACCEL_NUM_AXES; i++)
- {
- for (uint16_t j = ACCEL_WINDOW_SHIFT_IN_SAMPLES; j < ACCEL_TOTAL_SAMPLES_PER_ACCEL_CHANNEL; j++)
- {
- // accels_lowPowerAccelSamples[i][j - ACCEL_WINDOW_SHIFT_IN_SAMPLES] = accels_lowPowerAccelSamples[i][j];
- accels_highGAccelSamples[i][j - ACCEL_WINDOW_SHIFT_IN_SAMPLES] = accels_highGAccelSamples[i][j];
- }
- }
Below you can see example of sliding window:

Signal Conditioning
After acquisition of all 128 accel samples, all of them are passed through first order high pass filter with cutoff frequency of 240Hz. This process is mainly used to remove small low frequency movements as well as earth constant acceleration (~9,81) which would be problematic in next operations.
After filtering the signal is then integrated, transforming it from acceleration into velocity (rate of displacement).
Velocity signal is then centered around origin (average subtracted), to remove any residual constant signal which again, would be problematic in next operations.
Integrated and centered signal looks much cleaner:

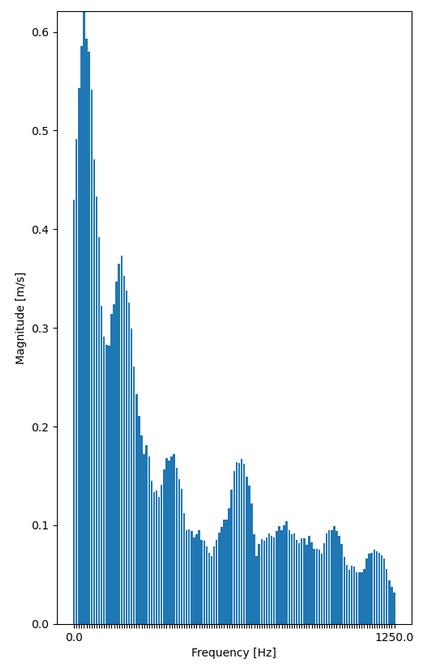
FFT
Filtered and integrated into velocity signals can now be processed from time domain into frequency domain using Fast Fourier Transform to separate it into various frequencies. This is standard procedure in defect detection as at times it can be easy to spot defects just looking at frequency charts. In example, ideal motor rotating 1000 times a second would have frequency spike at 1kHz. Having spikes at other frequencies would be suspicious. Before processing singnal through FFT a Hamming window (weight vector in which samples closer to start and end of the window are weighted less than those in center) was applied to it to reduce spectral leakage that occurs due to the signal being finite.
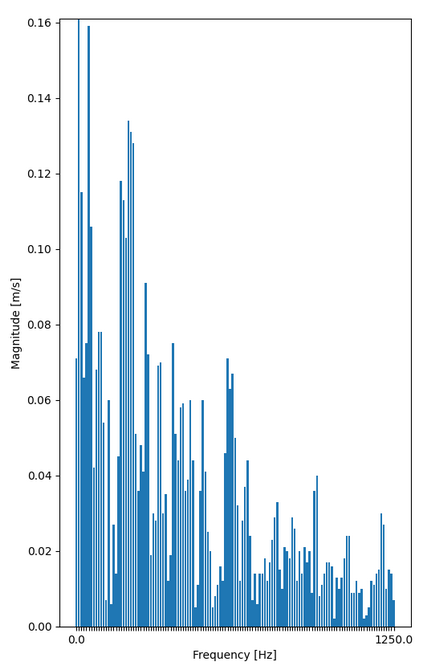
After FFT, RSS (Residual Sum of Squares) was applied to it to smooth frequencies a bit:
PCA
At this time I have collected over 1000 windows of running (without defect) generator with and without load. These samples were then used to create PCA (Principal Component Analysis) model. This model reduces the dimensionality of the data allowing to create smaller neural classifier. In short, PCA transforms data from default coordinates (FFT magnitudes) into principal components coordinates (based on data deviation). Then least important coordinates (these with smallest deviations) are then removed as these don't provide too much value. Fun fact: PCA is often used as fault detection method by comparing original samples of data transformed to reduced and non reduced data. Computing loss function based on reduced and non reduced data gives us info: if it's too big then it means that there is some abnormality in received sample of data.
- # Data loading.
- df = pd.read_csv("samples.csv")
- samples = df.to_numpy()
- num_cols = samples.shape[1]
- num_samples = samples.shape[0]
- # Normalization.
- means = np.mean(samples, axis=0)
- deviations = np.std(samples, axis=0)
- normalized_samples = (samples - means) / deviations
- # Correlation matrix.
- R = 1 / (num_samples - 1) * np.transpose(normalized_samples) @ normalized_samples
- # Eigen values and vectors.
- eigen_vals, eigen_vecs = np.linalg.eig(R)
- # Sort them from highest values.
- idx = eigen_vals.argsort()[::-1]
- eigen_vals = eigen_vals[idx]
- eigen_vecs = eigen_vecs[:, idx]
- # Zero columns that correspond to eig values that are less than 1 (those variables are worth less than 1 variable).
- eigen_vecs_prim = eigen_vecs.copy()
- eigen_vecs_prim[:, eigen_vals < 1] = 0
- # Remove zeroed columns.
- eigen_vecs_prim_reduced = eigen_vecs_prim[:, ~np.all(
- eigen_vecs_prim == 0, axis=0)]
After processing collected windows through PCA I've received PCA matrix (model) with 387 rows and 70 columns. This means that I've reduced my measurement from 3 * 256 = 768 samples to only 70! This is around 89% of data reduction. This will certainly help to create much more condensed neural model.
There is a problem with this though. Matrix this big would take 387 * 70 * 4 (size of float) = 108360 bytes of memory. Thast A LOT. At this point I've decided to quantize this method to signed 8 bit integers (this method is also used in neural networks in the same manner).
- # Multiplying by this will scale eigen vectors to range of int8.
- eigen_vecs_scaler_int = 127.0 / np.max(np.abs(eigen_vecs_prim_reduced))
- eigen_vecs_reduced_scaled = (eigen_vecs_prim_reduced * eigen_vecs_scaler_int).astype(int)
This reduced original floating point matrix to 1/4 of it's original size but also introducted quantization error, which in my case was 5% at max, which is not a big deal to be honest.
This script autogenerates C's source and header file so i can just copy / paste them to Thingy's source code and use immediately (see thingy/pca_dataset_collector/pca_creator.py in attached repo for source code generator).
Neural Classifier
To generate the model I needed some PCA samples that are correctly labeled. To do so I've created simple script (thingy/neural_dataset_collector/neural_sample_collector.py), which listens to the thingy over serial port. Each sample is a csv files containing 10 PCA samples (700 values total) obtained with frequency of 20Hz, which means that single measurement spans 500ms. Totally I've collected 4000 csv files, 1000 for each label.
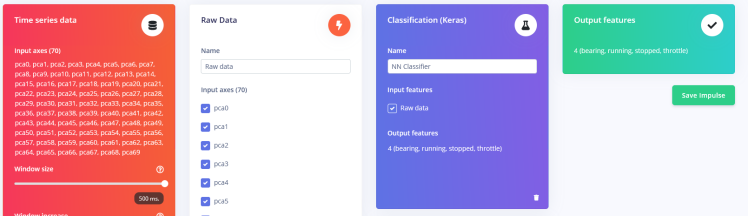
To classify obtained PCA samples I've used Edge Impulse model which takes all 70 PCA samples as input and returns probability of four classes: bearing fault, motor running, motor stopped and motor throttle. The window of the data is the same as the one used to obtain dataset and it's increment is based on single measurement, which means 50ms. Frequency set is also the same as the one used to obtain the dataset. For the input type I've selected Raw Data block as my input is already preprocessed via filters, FFT and PCA. Using these parameters means that my model takes one whole csv sample of 700 values as an input vector.
The model itself is rather simple as it consists of only Dense layers with dropout in between for better learning:
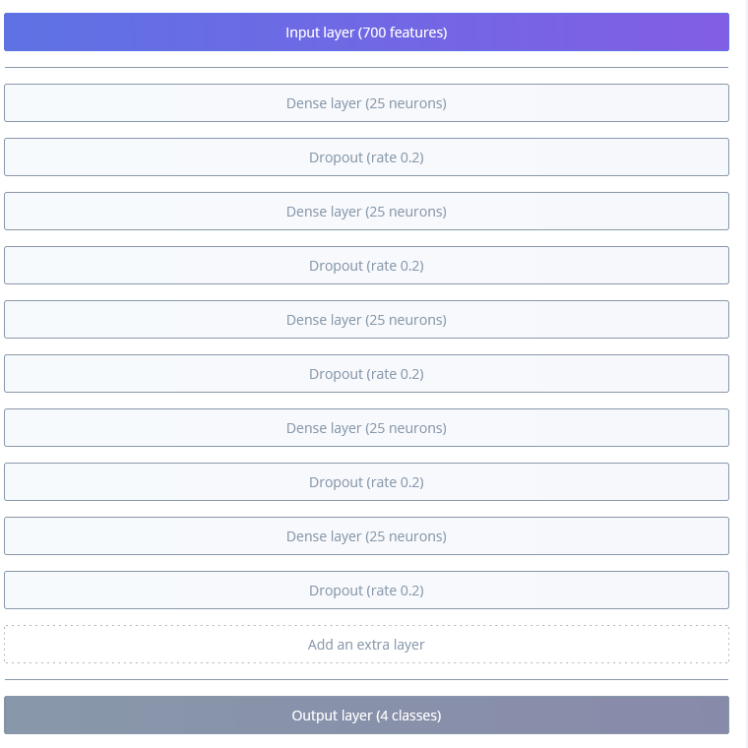
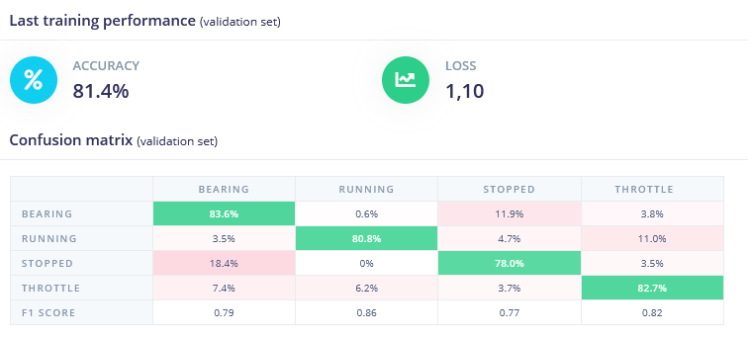
Using 0.0002 learning rate for 150 training cycles I've managed to achieve accuracy of around 80%, which should work good enough for fast real time classification.
The model was exported as C++ library in quantized form and included in Thingy's source code.
The classification is performed using sliding window technique, in which every time new measurement is performed (70 PCA samples), the oldest measurement is dropped and this new one takes it's place. there are 10 PCA buffers (700 values), This means that one measurement is used for 10 classification tasks until it's removed from the buffered memory.
To make the classification a bit more robust, I've added threshold check for each of the predictions. Only predictions above 80% are considered as trustworthy. If no class meets this requirement then NOT_SURE is returned.
- Classification inference(float buf[PCA_RESULT_SIZE])
- {
- for (uint16_t i = 0; i < PCA_RESULT_SIZE; i++)
- bufs[lastBuf][i] = buf[i];
- featureSig.total_length = PCA_RESULT_SIZE * INFERENCE_WINDOW_SIZE;
- featureSig.get_data = &loadData;
- run_classifier(&featureSig, &classificationResult);
- lastBuf++;
- if (lastBuf >= INFERENCE_WINDOW_SIZE)
- lastBuf -= INFERENCE_WINDOW_SIZE;
- if (classificationResult.classification[BEARING].value > 0.8)
- return BEARING;
- if (classificationResult.classification[RUNNING].value > 0.8)
- return RUNNING;
- if (classificationResult.classification[STOPPED].value > 0.8)
- return STOPPED;
- if (classificationResult.classification[THROTTLE].value > 0.8)
- return THROTTLE;
- return NOT_SURE;
- }
IoT Functionality
The IoT functionality is rather simple. The sensor sends messages via MQTT over LTE to one topic: "sample_motor/maintenance". The messages are simple too. In case of warning or critical error it sends one of the following strings:
- Motor stopped!
- Bearing failure!
- Motor throttles!
To save transfer data, these messages are sent at most once per 10 minutes. Also there is no "motor running" as it's pretty pointless.
To make the sensor more visible, there is also built in LED used for visual messages. When motor is in running state, sensor is lit in constant green color. When motor is stopped or in NOT_SURE state, then it blinks in yellow color indicating warning. In case of bearing or throttle defects the sensor blink fast in red color, which makes the sensor (and faulty generator) more visible to the service men.
Summary
To sum it up, whole sensor's measurement pipeline can be seen below:

CAD, enclosures and custom parts
Code
Credits
Related products


Leave your feedback...