

Power Dashboard With Pc Controls

Made by NotEnoughTech / Communication / Home Automation / Sensors / IoT
About the project
Control your PC and monitor the power consumption of the connected device. I used a NETIO cable to power up my PSU (a similar effect can be achieved with Sonoff POW R2) to take over the control and measurements.
Project info
Difficulty: Easy
Platforms: Raspberry Pi
Estimated time: 1 hour
License: Creative Commons Attribution CC BY version 4.0 or later (CC BY 4+)
Items used in this project


Story
PC Dashboard using NETIO Power Cables
I always wondered how much power my desktop computer draws. The 750W PSU can draw a lot in theory, but for most of the time, the PC is idling at 20% CPU use. There is more than one reason for using NETIO Power Cable 101x for that, unlike Sonoff POWR2, the unit already comes with C-14 (PSU cable), it’s sturdy, and there is no need to flash custom software.
NETIO Power Cables
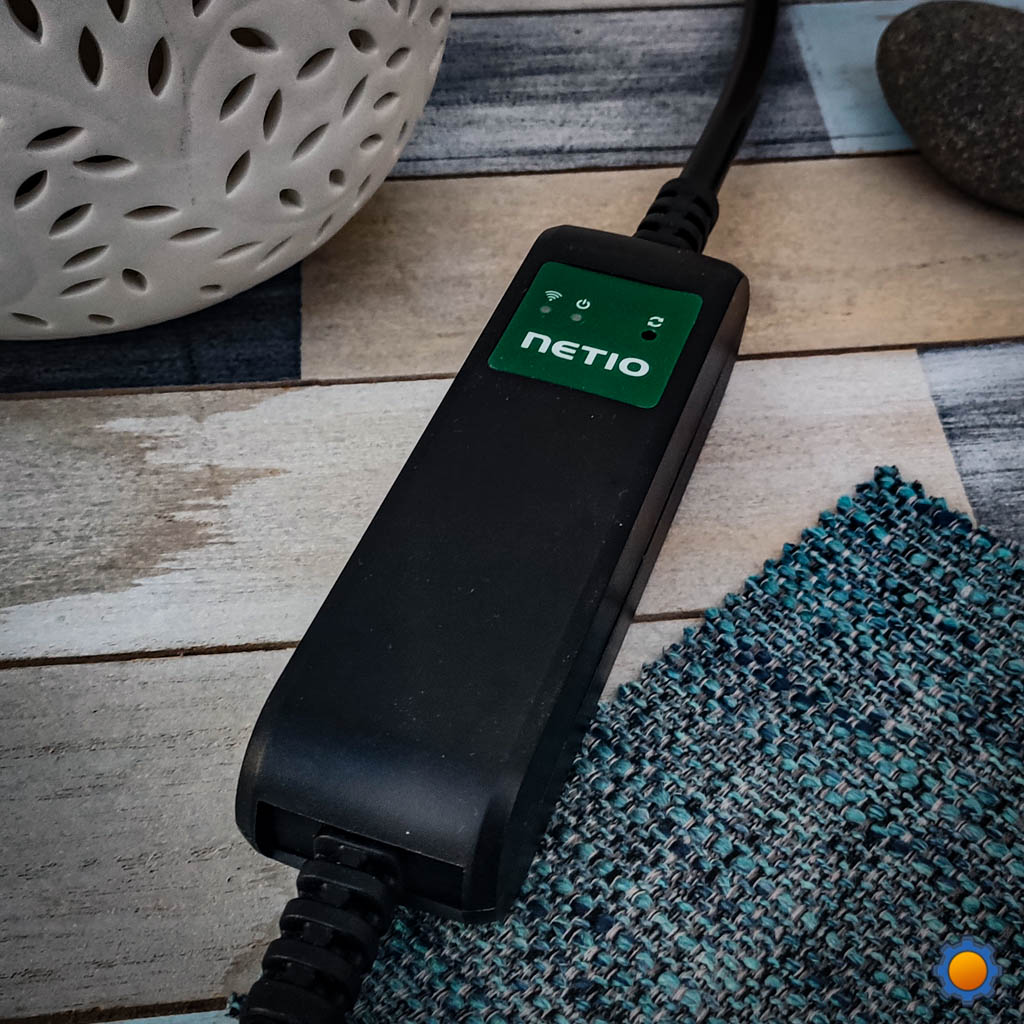
NETIO products come in many shapes, but I got the PC cable for 2 reasons:
- toggling power ON|OFF
- monitoring power use
You could achieve this with a Sonoff POW R2, but NETIO power cables come with a protected button toggle, which is hard to toggle accidentally. You need a pin, and 3 presses to change the state. The company clearly wants to reduce the danger of that to zero.
I picked the NETIO Power Cable REST 101x as I wanted to submit the data to my NodeRED server via HTTP requests. The API is well documented and it’s very easy to work with.
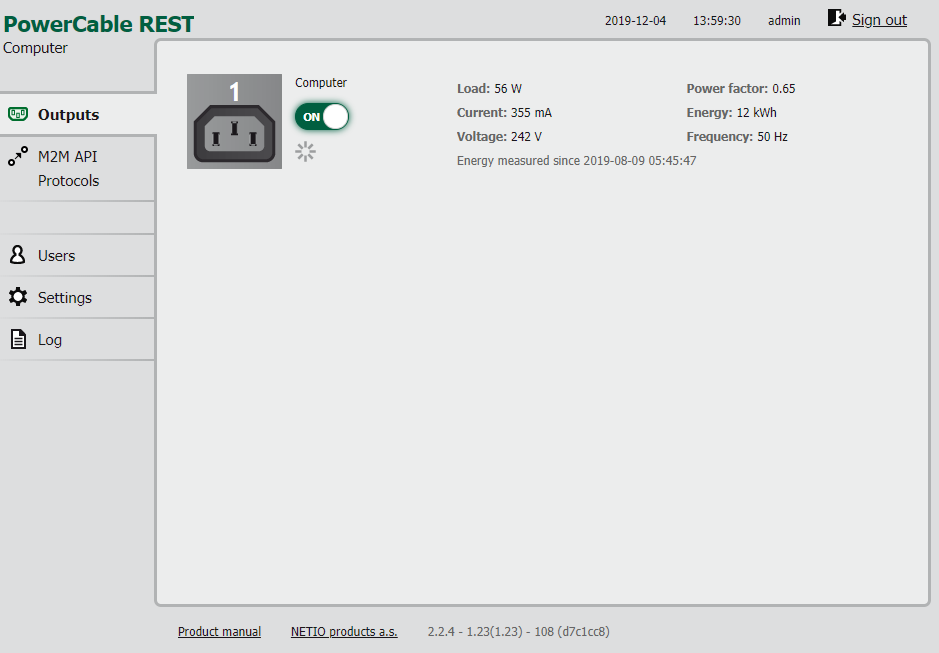
NETIO power cables come with a basic GUI hosted at port 80, but for the most part, you will interact with the cable via API. I took a couple of screenshots to show you what’s available.
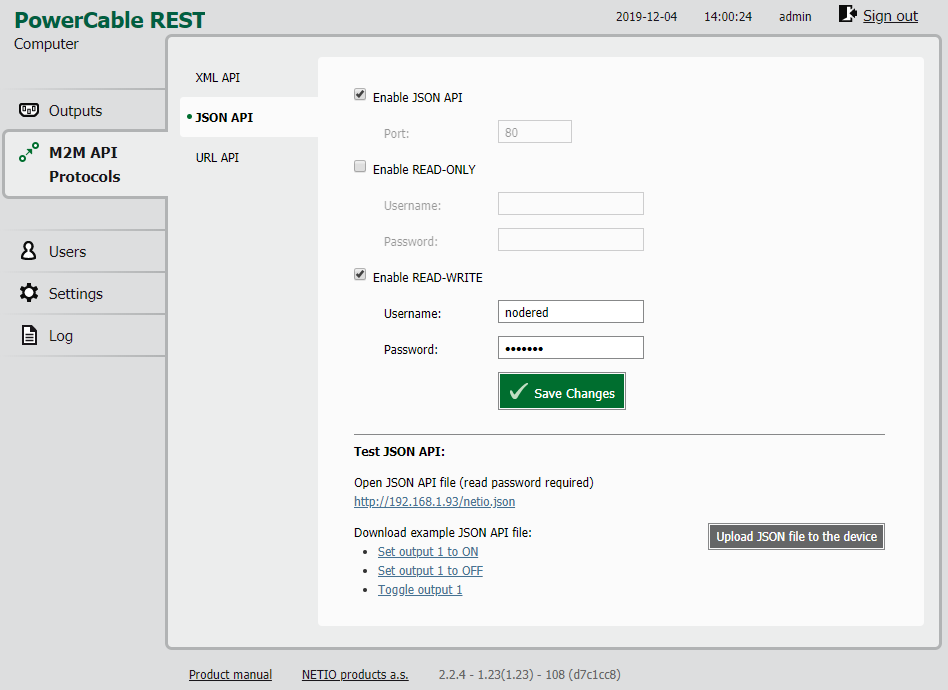
The data can be transferred via JSON, XML and URL. I’m dealing with NodeRED, JSON would be the perfect fit. Here is the data structure:
{ "Agent": { "Model": "101x", "DeviceName": "Computer", "MAC": "24:A4:2x:xx:xx:xx", "JSONVer": "2.0", "Time": "2019-12-04T11:07:26+00:00", "Uptime": 54111, "Version": "2.2.4", "OemID": "5", "VendorID": "0", "NumOutputs": 1 }, "GlobalMeasure": { "Voltage": 240, "TotalLoad": 52, "TotalEnergy": 12596, "OverallPowerFactor": 0.63, "Frequency": 50.0, "EnergyStart": "2019-08-09T05:45:47+00:00" }, "Outputs": [ { "ID": 1, "Name": "Computer", "State": 1, "Action": 6, "Delay": 2000, "Current": 344, "PowerFactor": 0.63, "Energy": 12596, "Load": 52 } ] }PC Dashboard
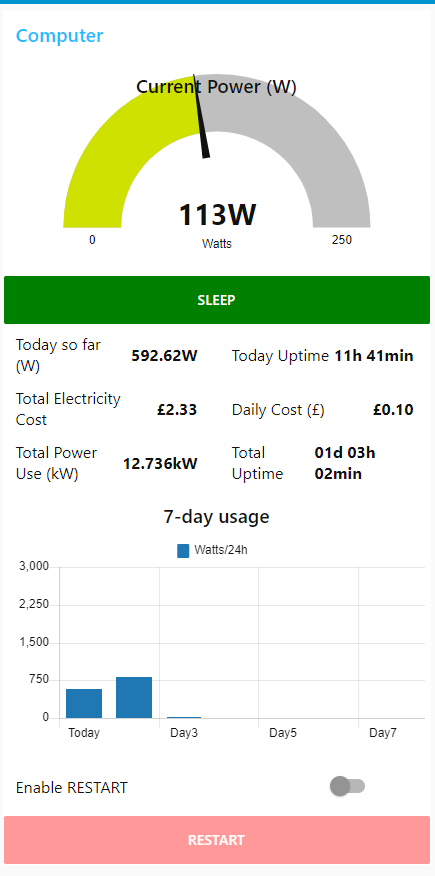
You will notice that my PC dashboard displays more details than what’s available via NETIO Power Cables. I took advantage of my previous projects (Washing Machine Notifications & Mobile Notifications for 3D Printers) to calculate the power used by my computer and the costs associated with it.
By default, I pull the data every 10 seconds, but the script is modified to support custom refresh rates. Make sure to preserve the NodeRED variables so the values wouldn’t be lost on NodeRED restart.
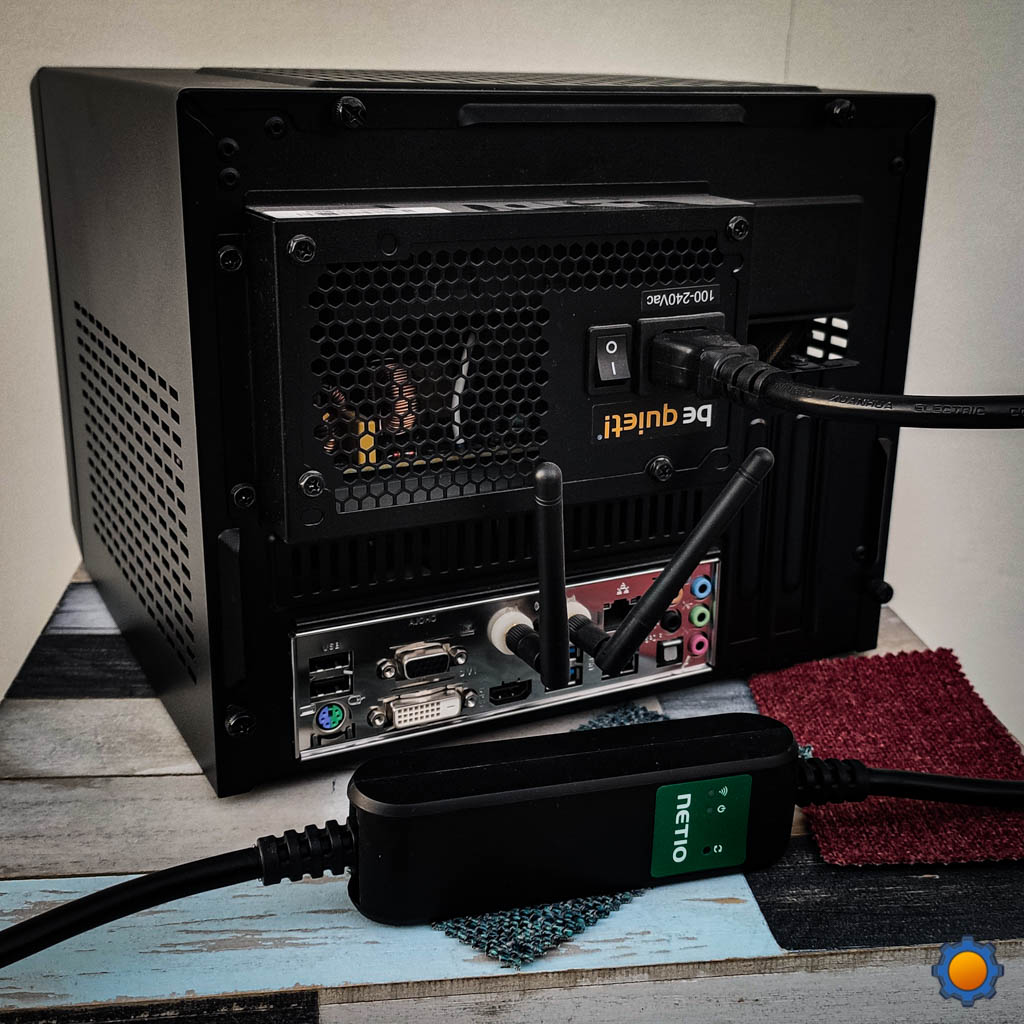
Not my PC, my case would not fit here!
Every 10 seconds
An HTTP GET request is sent to NETIO Power Cable. To make my life easier, I decided to store all values in flow variables. Based on the current load TotalLoad I update the main button on my dashboard (more about it here) and push correct values to display the data in the chart. (more about it here).

Then, a function node Calculate All takes care of all the values for me. These are split into three categories:
//get values var totalload = flow.get("TotalLoad"); var totalenergy = flow.get("TotalEnergy"); var refresh = flow.get("refresh_rate"); var totalusebyday = flow.get("TotalUseByDay"); var totalusebyhour = flow.get("TotalUseByHour"); var timetotal = flow.get("TimeTotal"); var timeday = flow.get("TimeDay"); var cost = global.get("PowerCost"); var averageuseperhour = flow.get("AverageUsePerHour"); //ERROR HANDLING // functions function calcTimeHM(hh){ var hours = ("0"+Math.floor((hh%86400)/3600)).slice(-2); var minutes = ("0"+Math.floor((hh%3600)/60)).slice(-2); return hours + "h " + minutes +"min"; } function calcTimeDHM(hh){ var days = ("0"+Math.floor(hh/86400)).slice(-2); var hours = ("0"+Math.floor((hh%86400)/3600)).slice(-2); var minutes = ("0"+Math.floor((hh%3600)/60)).slice(-2); return days+"d " +hours + "h " + minutes +"min"; } function add(accumulator, a) { return accumulator + a} //WATTAGE //total kWh var kw = totalenergy/1000; //today so far W var todayw1 = totalusebyhour[0]; if(todayw1 === 0){ var todayw = averageuseperhour.toFixed(2); } if(todayw1 !== 0){ todayw = (totalusebyhour.reduce(add) + averageuseperhour).toFixed(2); } // Watts used in X sec (W per h) var houruse = ((totalload/3600)*refresh); var currentuse = averageuseperhour + houruse; //COST //calculate the day cost per used kWh var daycost1 = totalusebyhour[0]; if(daycost1 === 0 || undefined){ var daycost = (averageuseperhour/1000 * cost).toFixed(2); } if(daycost1 !== 0){ daycost = ((totalusebyhour.reduce(add))/1000 * cost).toFixed(2); } //calculate the day cost per used kWh var totalcost = (totalenergy/1000*cost).toFixed(2); //TIME //calculate uptime if(totalload => 5){ //total uptime var timeT = timetotal + 10; var timeTdisplay = calcTimeDHM(timeT); //daily so far uptime var timeD = timeday + 10; var timeDdisplay = calcTimeHM(timeD); } if(totalload < 5){ //total uptime timeT = timetotal; timeTdisplay = calcTimeDHM(timeT); //daily so far uptime timeD = timeday; timeDdisplay = calcTimeHM(timeD); } //update values flow.set("TimeTotal", timeT); flow.set("TimeDay", timeD); flow.set("AverageUsePerHour", currentuse); //final payload msg.payload = { "kwh" : kw, "todayw" : todayw, "daycost" : daycost, "totalcost" : totalcost, "currentuse" : currentuse, "timeT" : timeT, "timeTdisplay": timeTdisplay, "timeD" : timeD, "timeDdisplay": timeDdisplay, "totalload" : totalload, "totalenergy" : totalenergy }; return msg;
Watts
Total Watts used are taken directly from the NETIO Power Cable (TotalEnergy). To get a daily breakdown, I could save the value every 24h and do some easy maths, but I wanted the power use per day to be available constantly.
I split this into 3 measurements:
- per hour (Watts used in 10-sec increments)
- per day (Watts from each hour and the current hour)
- per week (Watts saved after each 24h period)
This way the correct power will be displayed on your dashboard. To calculate how much power had been used, simply use: var houruse = ((totalload/3600)*refresh);
Uptime
Calculating uptime was actually very simple, for every 10 seconds passed (update) I would add +10 to both arrays TimeTotal & TimeDay.
The daily value would be reset every 24h. To display the value in a more human format I used the scripts to calculate Seconds to DD:HH:MM:SS, it's a very good reddit collaboration where we came up with neat solutions to leading zeros and other problems.
Cost
Since I know how much I pay for kWh, I can estimate the cost of running my PC. Both calculations are simple once you have the total energy used. If you have 2 power tariffs, you will need to take a look at the Mobile Notifications for 3D printers to introduce multiple tariffs into your schedule.
Bear in mind that I'm using my credential system to store the important values in global variables and distribute them to other devices.
Every 1h
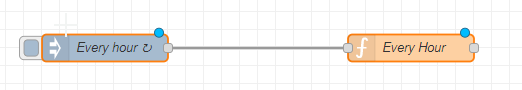
Every hour, NodeRED collects the power used in the last hour and pushes that data to the TotalUseByHour array. The AverageUsePerHour is cleared and ready to collect new power information.
var total = flow.get("TotalUseByHour"); if(total === undefined){ total = [0]; flow.set("TotalUseByHour", total); } if(!total || !total.length || total === undefined){ total = [0]; } //push element to an array 1st postition var value = flow.get("AverageUsePerHour"); total.unshift(value); flow.set("TotalUseByHour", total); flow.set("AverageUsePerHour", 0);
Every 24h
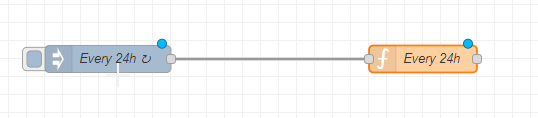
Every 24h values stored in the TotalUseByHour array are added together and pushed to the TotalUseByDay array. This array will hold the last 7 days of data so I could display it on the dashboard chart as well.
The hour details are cleared at midnight, and the 8th day is removed from the array so the chart consists of the weekly breakdown only.
var totalD = flow.get("TotalUseByHour"); var weektotal = flow.get("TotalUseByDay"); flow.set("TimeDay", 0); if(!totalD || !totalD.length || totalD === undefined){ totalD = [0]; return msg; } function add(accumulator, a) { return accumulator + a} //Watts per 24h var usedperday = totalD.reduce(add); weektotal.unshift(usedperday); flow.set("TotalUseByDay", weektotal); totalD.splice(0,totalD.length); totalD = [0]; flow.set("TotalUseByHour",totalD); var totalW = flow.get("TotalUseByDay"); if(!totalW || !totalW.length || totalW === undefined){ totalW = [0]; return msg; } //keep x number of elements in an array var position = 7; if(totalW[position] === undefined) { //do nothing if array empty } else { totalW.splice(position, 7); //remove 1 element from position flow.set("TotalUseByDay", totalW); }
Dashboard extras
Interactive button
Instead of multiple buttons, I opted out for a single one which changes ist behaviour based on the power use. The button can:
- put PC to sleep
- wake PC up
- power cycle NETIO Power Cable
I already have the WOL setup in NodeRED so implementation was very easy. All I had to do is to issue an HTTP request to reset the NETIO power cable and protect this action with 2FA (two-factor authentication tutorial) to prevent the accidental use.
The button has 3 states that are stored as a flow variable Power_function. The value sleep|reset|wol decides what action is taken once the button is pressed.
Protected button
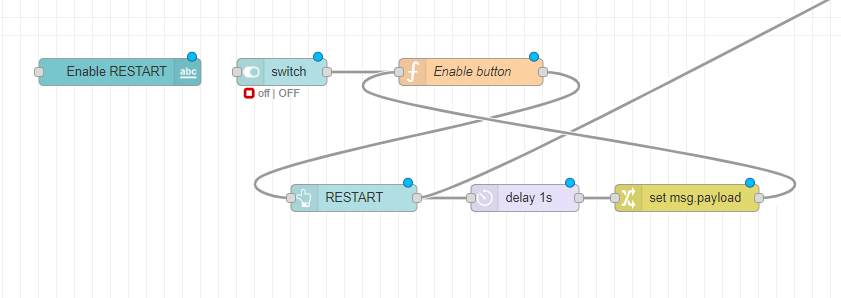
There is one more way to invoke a safe power cycle. I used a switch in the dashboard to enable|disable the reset button. Now I can power cycle my PC anytime without the risk of doing it by mistake.
To force the PC to start-up after power loss, visit BIOS settings. You will need to enable that function. Check the power options and look for PC behaviour after the power loss.
Better Charts
Initially, I had my charts displaying the data after 24h. Waiting a full day (or more) to see the results wasn't fun so I decided to add a couple of conditions.
Improved charts will display the present-day only if there are no other values, and current hour by hour use as well. To achieve this, I used a couple of IF statements to check the array values before the graph is updated.
var arrayD = flow.get("TotalUseByDay");
var arrayH= flow.get("TotalUseByHour");
var averageperhour = flow.get("AverageUsePerHour");

//if array doen't exist
if(arrayD === undefined){
    arrayD = [0];
    flow.set("TotalUseByDay", arrayD);
}
if(arrayH === undefined){
    arrayH = [0];
    flow.set("TotalUseByHour", arrayH);
}

//function
function add(accumulator, a) {
            return accumulator + a}


//set data, label and series for the chart

var m = {};
var count = arrayD.length;

if(count === undefined || count < 2){

    m.labels = ["Today"];
    m.data = [[]];
    m.series = [];


    if(arrayH[0] === 0){
        m.data[0].push(averageperhour.toFixed(2));
        m.series.push("Watts/24h");
    }
    if(arrayH[0] > 0){
        var usedperday = arrayH.reduce(add);
        m.data[0].push(usedperday.toFixed(2));
        m.series.push("Watts/24h");
    }


    return {payload:[m],topic:msg.topic};
}

else{

    m.labels = ["Today","Yesterday","Day3","Da4","Day5","Day6", "Day7"];
    m.data = [[]];
    m.series = [];
    if(arrayH[0] === 0){
        m.data[0].push(averageperhour.toFixed(2));
        m.series.push("Watts/24h");
    }
    if(arrayH[0] > 0){
        usedperday = arrayH.reduce(add);
        m.data[0].push(usedperday.toFixed(2));
        m.series.push("Watts/24h");
    }m.series.push("Watts/24h");

for (i=0; i<count; i++){
    m.data[0].push(arrayD[i].toFixed(2));
    m.series.push("Watts/24h");
}

return {payload:[m],topic:msg.topic};
}
Conclusion
To answer my question: How much actual power my 750W PSU is using? Turns out, not that much! The desktop PC uses 50-60W an hour, with peaks 270W while the machine is rendering videos. Running this beast (i7 + GTX2080) daily costs less than £0.30 which is OK.
There is one elephant in the room that I should address. NETIO Power Cables are expensive. Right now you can get one for €99 + VAT. Clearly the cables are designed for specific industry use cases with business customers in mind. It's going to be very hard to beat DIY Sonoff POWR2 approach where the same could be achieved for much less (with not as pretty effect).
If you want to get the latest updates to this project you can follow me via your preferred social media:
And if you feeling like buying me a coffee or supporting me in a more continuous way:
I hope you have enjoyed the project!
Code
Credits
NotEnoughTech
Some say I run a decent tech blog online. The truth is I needed to find a hobby that fits between my bicycle rides. Robotics engineer in making at Labman.
Related products


Leave your feedback...