
Get Live Weather Data From The Internet Ttgo Esp32
Made by Ron / Notifications / Wearables / Weather / IoT
About the project
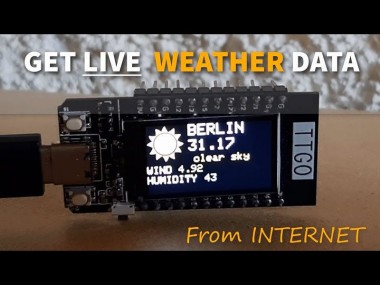
In this tutorial we will learn how to get the weather data based on location from the internet using TTGO ESP32 and Visuino.
Items used in this project

Story
In this tutorial we will learn how to get the weather data based on location from the internet using TTGO ESP32 and Visuino.
Watch the Video!
Step 1: What You Will Need
1 / 2

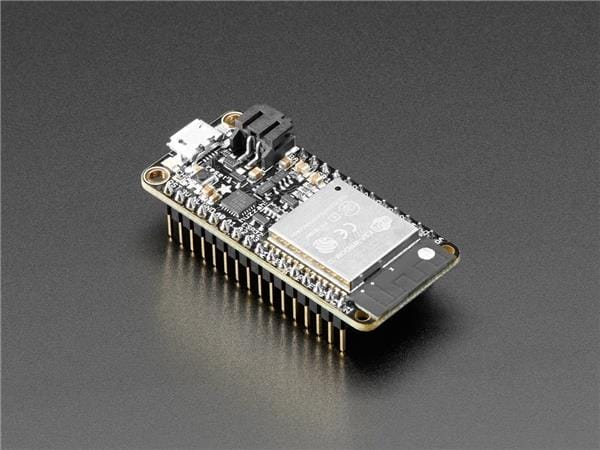
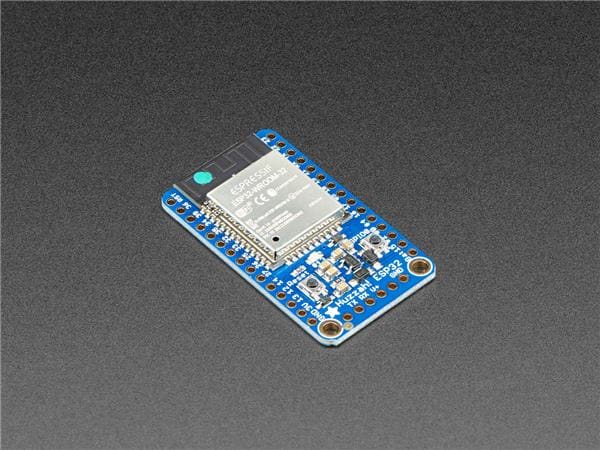
- TTGO ESP32
- WiFi connection
- A Free API account on the openweathermap.org (also Explained in the Next Step)
- Visuino program: Download Visuino
Step 2: OpeanWeatherMap API
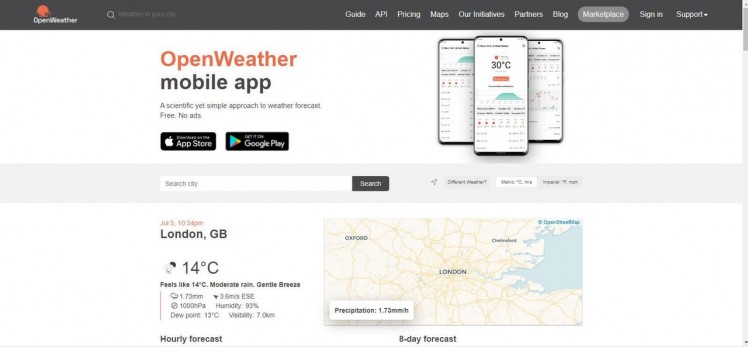
Go to https://home.openweathermap.org/users/sign_up and create an account then navigate to API page to copy the API Key
You can find more documentation about the API on this linkhttps://openweathermap.org/current#data
Step 3: Start Visuino, and Select the Arduino TTGO T-Display ESP32 Board Type
1 / 2
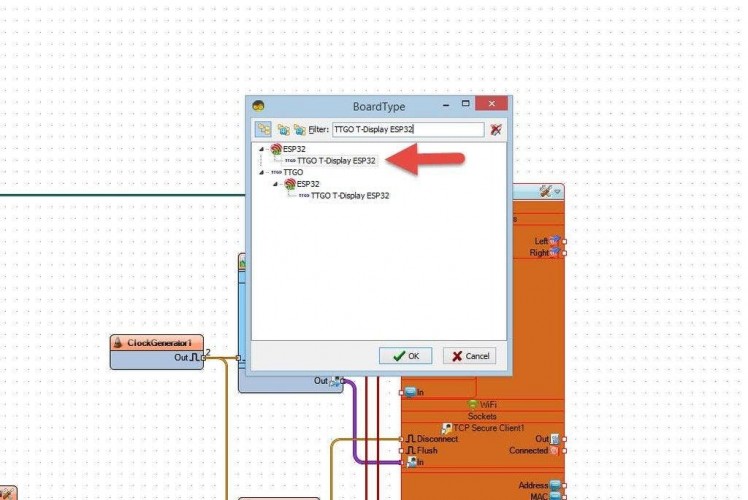
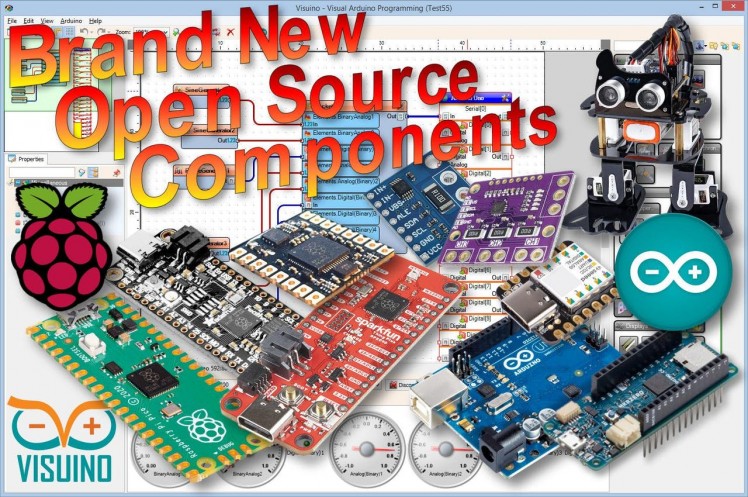
The Visuino: https://www.visuino.eu also needs to be installed. Download Free version or register for a Free Trial.
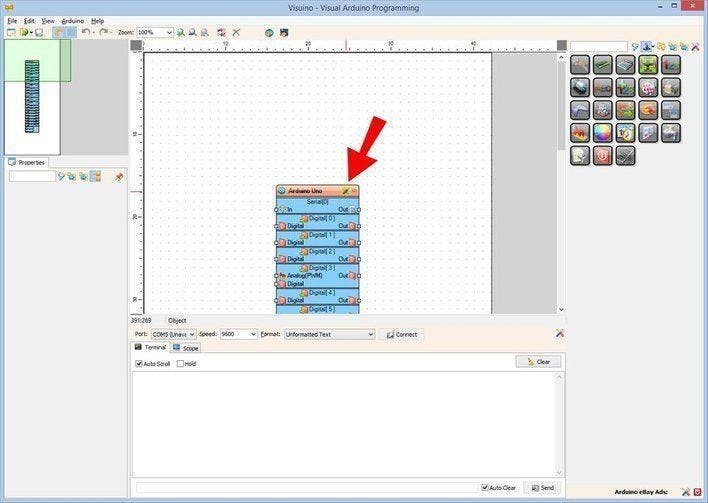
Start Visuino as shown in the first picture Click on the "Tools" button on the Arduino component (Picture 1) in Visuino When the dialog appears, select "TTGO T-Display ESP32" as shown on Picture 2
Step 4: In Visuino Set WiFi
1 / 6

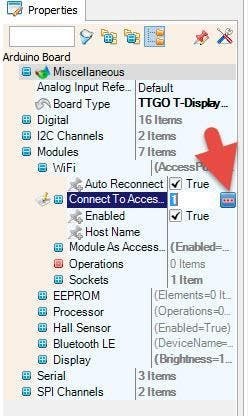
Select TTGO T-Display ESP32 board and in the properties window expand "Modules>WiFi>Connect To Access Points
- Click on the Connect To Access Points 3 Dots
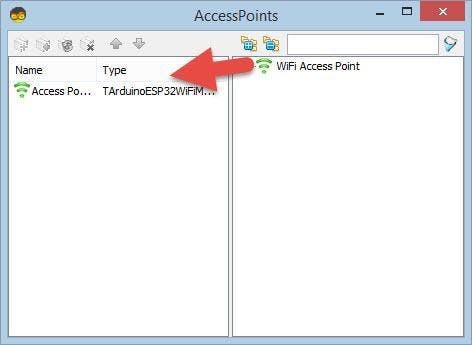
- In the AccessPoints window drag "WiFi Access Point" to the left side
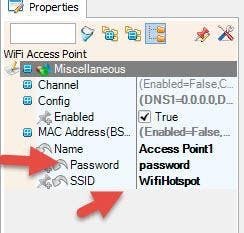
- In the properties window set SSID (name of your WiFi hotspot or router)
- In the properties window set Password (password of your WiFi hotspot or router)
- Close AccessPoints window
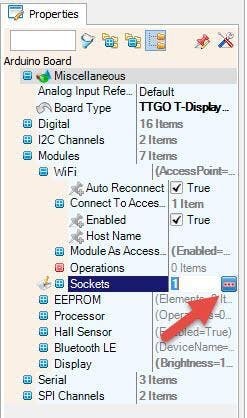
Select TTGO T-Display ESP32 board and in the properties window expand "Modules>WiFi>Sockets
- Click on the Sockets 3 Dots
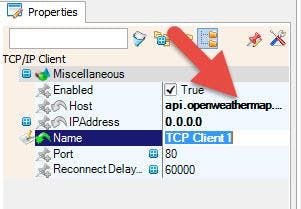
- In the "Sockets window" drag TCP/IP Secure Client (SSL) to the left
- In the properties window set Host to: api.openweathermap.org/
- Close the "Sockets window"
Step 5: In Visuino Set Display
1 / 13
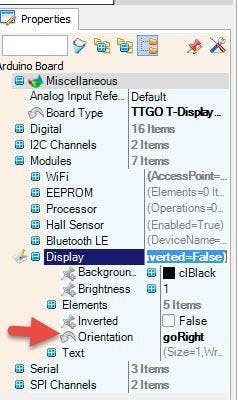
Select TTGO T-Display ESP32 board and in the properties window expand "Modules>Display>Orientation
Set Orientation to:goRight
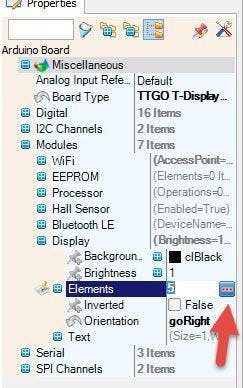
Select TTGO T-Display ESP32 board and in the properties window expand "Modules>Display>Elements
Click on the Elements 3 Dots
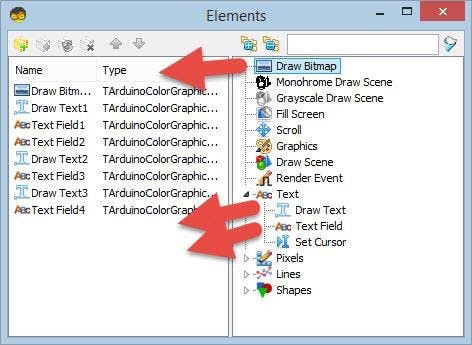
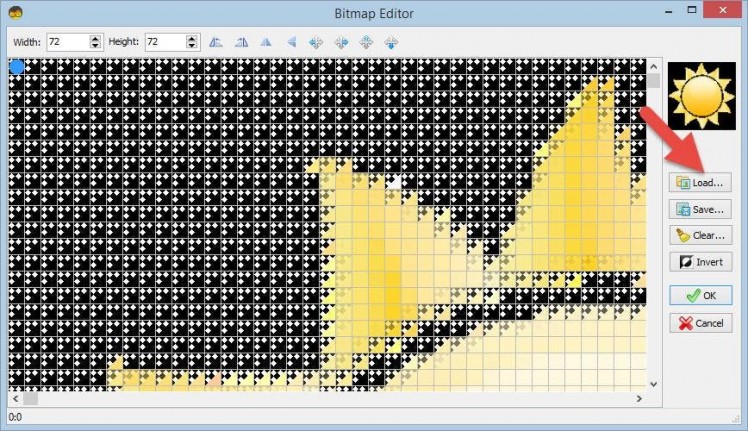
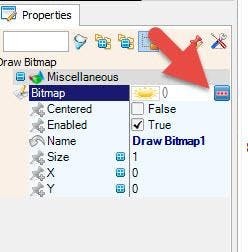
- In the Elements window drag Draw Bitmap to the left In the properties window:
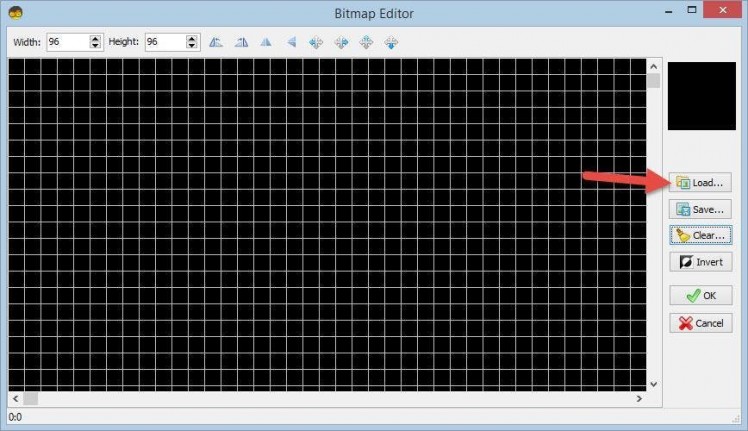
- Click on the Bitmap 3 Dots In the Bitmap Editor Load the Weather bitmap (picture 6) and close the Bitmap editor
You can find other bitmaps at https://iconarchive.com/search?q=weather
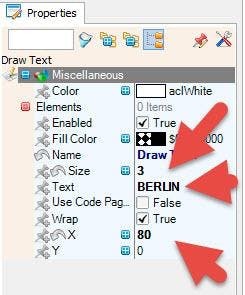
- In the "elements window" drag "Draw Text" to the left side and in the properties window set size to 3, "x" to 80 and in the text put your location, in our case its "Berlin"
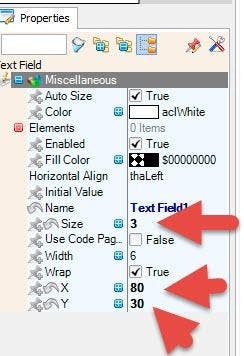
- In the "elements window" drag "Text Field" to the left side and in the properties window set size to 3, "x" to 80 and "y" to 30
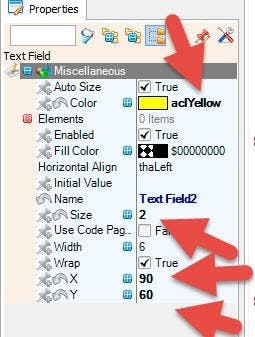
- In the "elements window" drag "Text Field" to the left side and in the properties window set size to 2, "x" to 90 and "y" to 60 and color to "aclYellow"
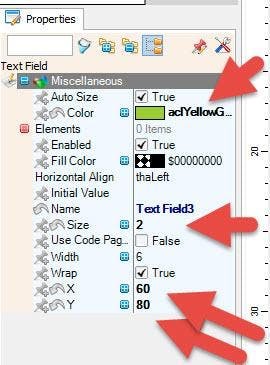
- In the "elements window" drag "Text Field" to the left side and in the properties window set size to 2, "x" to 60 and "y" to 80 and color to "aclYellowGreen"
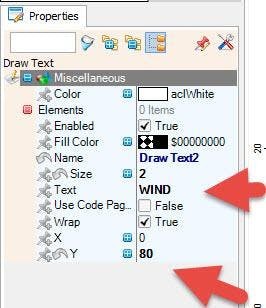
- In the "elements window" drag "Draw Text" to the left side and in the properties window set size to 2, "y" to 80 and text to "WIND"
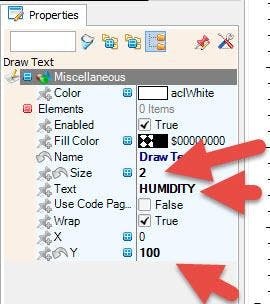
- In the "elements window" drag "Draw Text" to the left side and in the properties window set size to 2, "y" to 100 and text to "HUMIDITY"
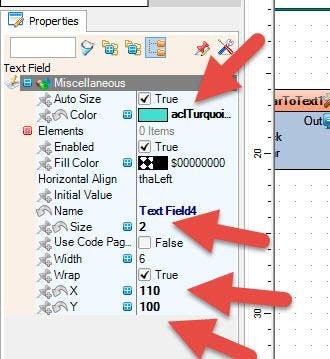
- In the "elements window" drag "Text Field" to the left side and in the properties window set size to 2, "x" to 110 and "y" to 100 and color to "aclTurquoise"
Close the Elements window
Step 6: In Visuino Add Components
1 / 11
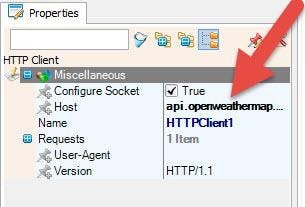

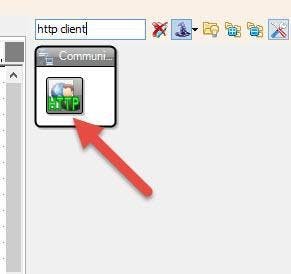
- Add "HTTP Client" component
- Select "HTTPClient1" and in the properties window set Host to api.openweathermap.org
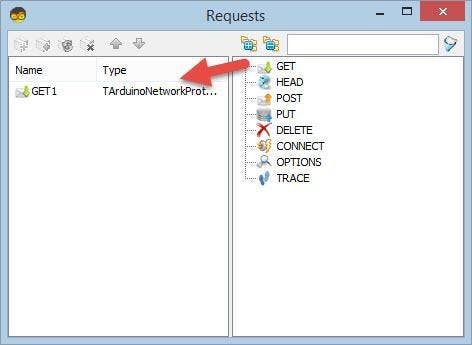
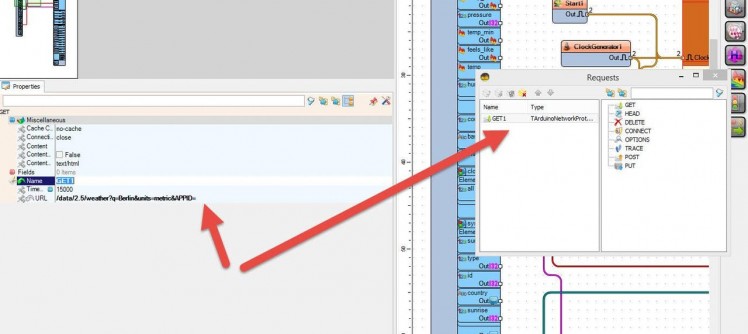
- Click on the Requests 3 Dots
- In the "Requests window" drag "GET" to the left side
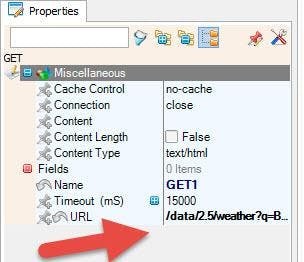
- In the properties window set URL to: /data/2.5/weather?q=Berlin&units=metric&APPID=123456Important!: above in the URL replace 123456 at the end with your API keyAlso replace "Berlin" with the name of your city
- Close the requests window
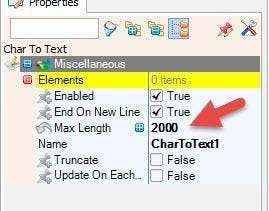
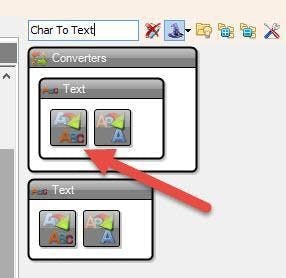
- Add "Char To Text" component
- Select "CharToText1" and in the properties window se Max Length to 2000
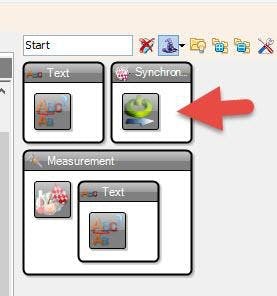
- Add "Start" component
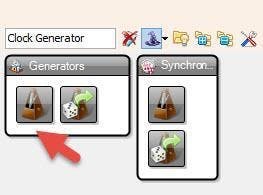
- Add "Clock Generator" component
- Select "ClockGenerator1" and in the properties window set frequency to 0.0016This is around 10min, so the data will be refreshed every 10min, you can change the frequency if you want
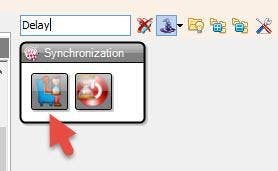
- Add "Delay" components and in the properties window set "Interval (uS)" to 2000000
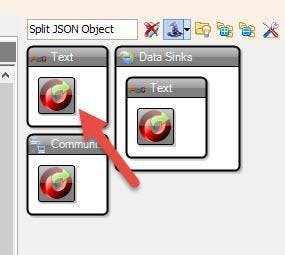
Step 7: In Visuino Parsing JSON
1 / 3
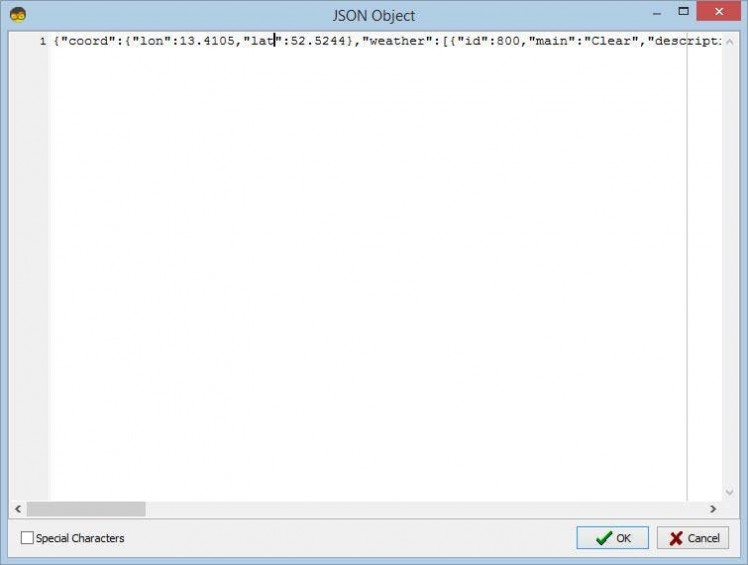
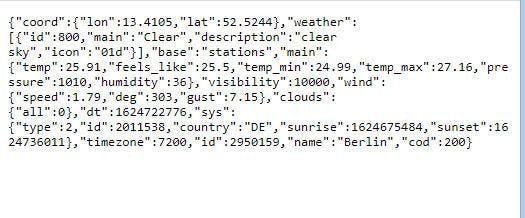
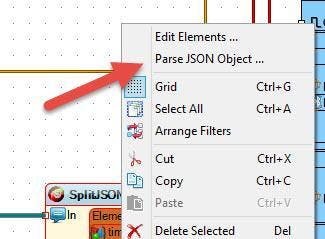
With the mouse right click on the "SplitJSON1" and in the menu click on the "Parse JSON Object.."In the "JSON Object" window paste this sample code(avalible on https://api.openweathermap.org/data/2.5/weather?q=Berlin&units=metric&APPID=YOURAPIKEYReplace YOURAPIKEY with your API key that you got in your accountOr copy paste the following:
{"coord":{"lon":13.4105,"lat":52.5244},"weather":[{"id":800,"main":"Clear","description":"clear sky","icon":"01d"}],"base":"stations","main":{"temp":25.91,"feels_like":25.5,"temp_min":24.99,"temp_max":27.16,"pressure":1010,"humidity":36},"visibility":10000,"wind":{"speed":1.79,"deg":303,"gust":7.15},"clouds":{"all":0},"dt":1624722776,"sys":{"type":2,"id":2011538,"country":"DE","sunrise":1624675484,"sunset":1624736011},"timezone":7200,"id":2950159,"name":"Berlin","cod":200}
Close the "JSON Object" window
"SplitJSON1" component will now create new pins
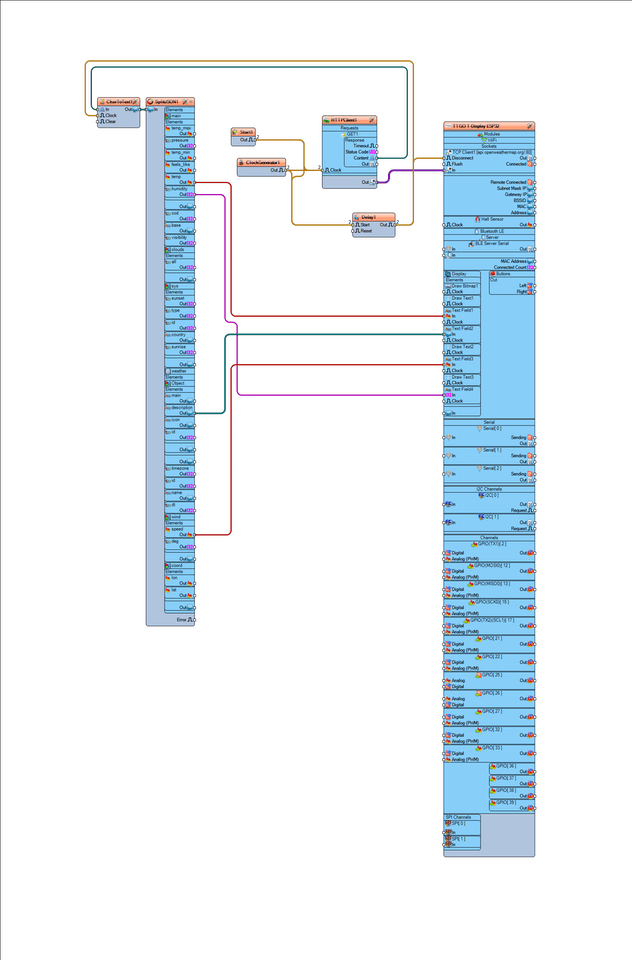
Step 8: In Visuino Connecting Components
1 / 3
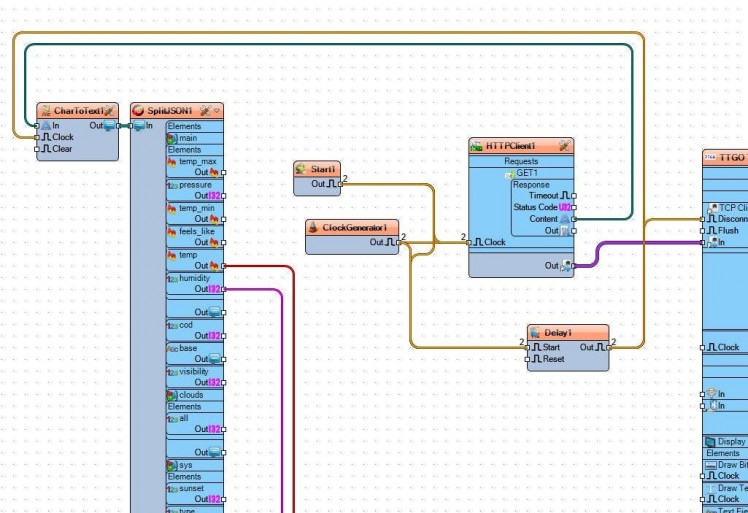
- Connect "ClockGenerator1" pin Out to "HTTPClient1" pin Clock and "Delay1" pin Start
- Connect "Start1" pin [Out] to "HTTPClient1" pin Clock and "Delay1" pin Start
- Connect "HTTPClient1" pin Content to "CharToText1" pin In
- Connect "HTTPClient1" pin to TTGO T-Display ESP32 > WiFi>TCP Secure Client1 pin In
- Connect "Delay1" pin Out to "CharToText1" pin Clock and TTGO T-Display ESP32 > WiFi>TCP Secure Client1 pin Disconnect
- Connect "CharToText1" pin Out to "SplitJSON1" pin In
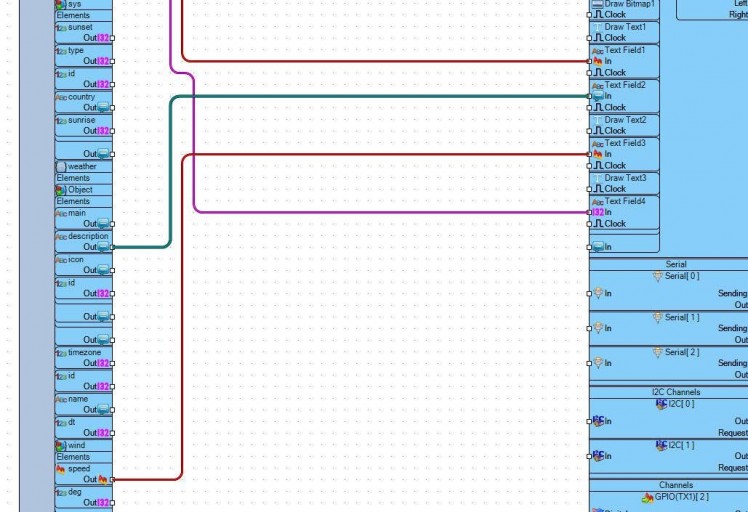
- Connect "SplitJSON1> temp to TTGO T-Display ESP32>Text Field1 pin In
- Connect "SplitJSON1> description to TTGO T-Display ESP32>Text Field2 pin In
- Connect "SplitJSON1> speed to TTGO T-Display ESP32>Text Field3 pin In
- Connect "SplitJSON1> humidity to TTGO T-Display ESP32>Text Field4 pin In
Note: you can also play with the other pins from "SplitJSON1" component
Step 9: Generate, Compile, and Upload the Code
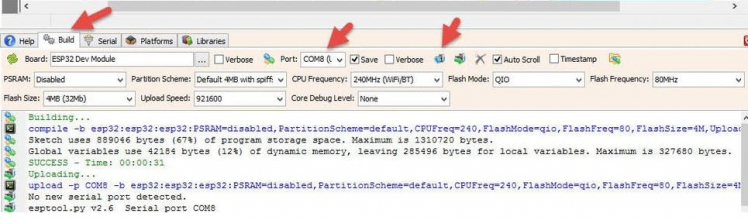
In Visuino, at the bottom click on the "Build" Tab, make sure the correct port is selected, then click on the "Compile/Build and Upload" button.
Step 10: Play
If you power the TTGO ESP32 module it will connect to the network and display the current weather data.
Congratulations! You have completed your project with Visuino. Also attached is the Visuino project, that I created for this tutorial, you can download it and open it in Visuino: https://www.visuino.eu
Note: In the File Project when you open it in Visuino, change the WiFi settings (Access point and password) to your settings AND Add the API KEY at the end of the URL
Schematics, diagrams and documents
Code
Credits
Related products


Leave your feedback...