
Automotive Tire Pyrometer Project

Made by Mouser Electronics / Automotive / Sensors / Sports
About the project
The concept is simple, it's a device that measures tire temperatures thereby allowing the driver to tune for optimal traction.
Project info
Difficulty: Difficult
Platforms: Arduino
Estimated time: 3 weeks
License: CERN Open Hardware Licence version 1.2 or later (CERN-OHL1.2+)
Items used in this project
Hardware components
View all
Hand tools and fabrication machines

|
Soldering iron | x 1 | |
|
|
Needle nose pliers | x 1 | |
|
|
Wire cutters | x 1 | |
|
|
Wire strippers | x 1 | |
|
|
Shrink wrap tubing | x 1 | |
|
|
22-24awg braided wire | x 1 | |
|
|
12awg solid house wire | x 1 | |
|
|
Thermal compound (Silver) | x 1 | |
|
|
Sand paper | x 1 |
View all
Story
Overview:
A tire pyrometer is a common tool within the racing community. The concept is simple, it's a device that measures tire temperatures thereby allowing the driver to tune for optimal traction. The goal of this project was to make a low cost alternative to some of the more costly commercial devices on the market. I knew there wasn't much to it and that I could reproduce a similar product for a fraction of the cost.
The pyrometer measures the temperature of a tire. The copper probe is jabbed into the tire itself, between the treads. The idea is that the probe tip should be about 1/16"-1/8" embedded into the rubber for good heat conduction. As long as tires are not extremely worn, then there should be plenty of rubber (1/4"-3/8") before you would poke through and puncture the tire. Some basic theory on how the components work will lay the ground work for System Build Up.
Step 1: Thermistor Theory
Thermistors are devices that change their electrical characteristic in response to temperature. Like the name suggests, resistance is the main characteristic that is dependent to temperature with these devices. Thermistors are very common in temperature applications because they provide high accuracy at a low cost.
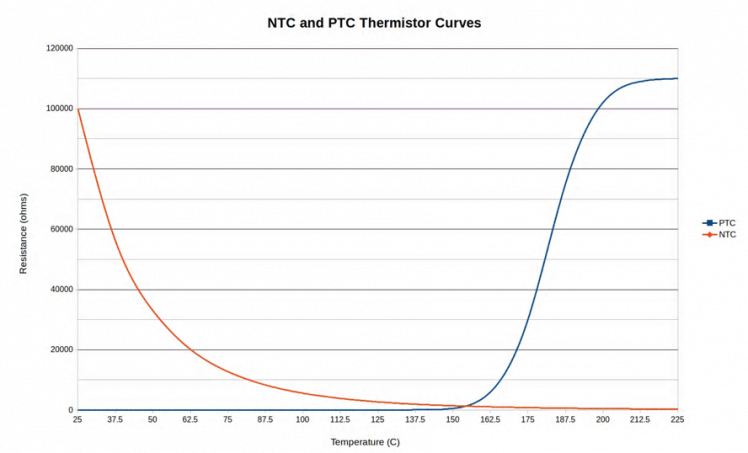
Most thermistors follow an exponential relationship between resistance and temperature. The graph above shows the difference between a negative and positive coefficient thermistor; often abbreviated NTC and PTC. The main difference between the two being that NTC shows an inverse R-T relationship and the PTC shows a direct relationship. For this project I chose an NTC thermistor for a wider temperature range and also because they tend to be a bit cheaper.

The equation above will produce the exact R-T curve for a Vishay NTC thermistor. Note the constants B and R25 within the equation; these values are specific for each thermistor. The R25 is the resistance of the thermistor at 25ºC. B has units of Kelvin (temperature), and relates to how quickly the graph drops off. Both of these values will be given to you in the component's datasheet. Keep in mind T is in units of Kelvin which is simple to convert from Celsius since Kelvin=Celsius+274.15. We will use these values and the RT equation in the next step to make some plots and tables to help us read the temperature with the microcontroller.
Step 2: Thermistor Reading Technique
So we have this component that reacts to temperature, but how do we actually read it using a microcontroller? The basic concept is called a voltage divider, and it uses the idea of series resistors having the same current.
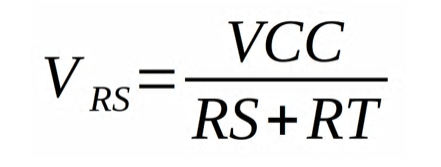
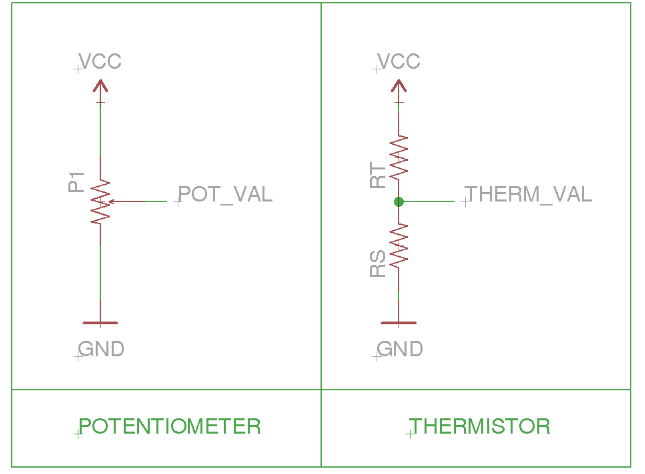
he voltage divider is a very common circuit, found in almost all electronic designs. Any time two resistors are in series with one another, the voltage over one will always have a ratio of the total voltage over the pair. In our case we are using the fact that the thermistor resistance RT will be varying; therefore, the voltage drop over RS will change accordingly. This is similar to a potentiometer except a potentiometer allows full range to either VCC or GND because one of the two resistors can drop to nearly 0Ω. In our case, we can't “sweep” all the way to GND because of the constant RS value. The equation above shows how we can determine the voltage over RS as a function of RT.
The nice thing about this equation is that we can physically measure VRS using the ATtiny84's built in analog-to-digital converters (ADC). Once we have that, it's simple enough to solve for RT and use the equation from step 1 above, Thermistor Theory, to find our temperature. The only problem is that a microcontroller isn't good at doing complex math, so we have to use an alternative method of calculating the result.
Step 3: Function Interpolation (approximation)
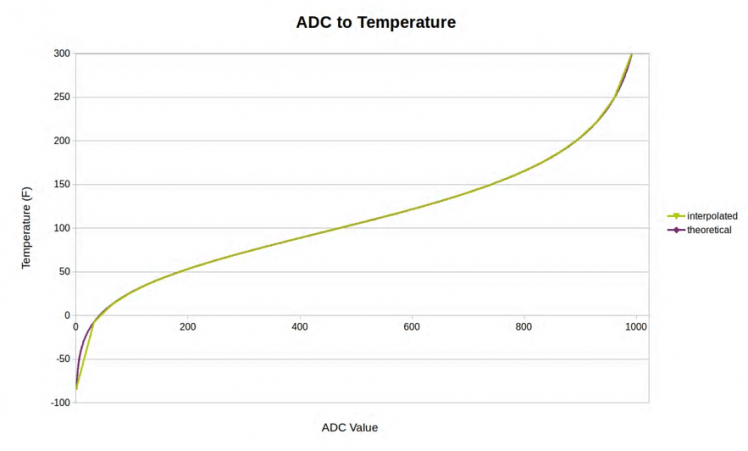
The graph above is the resulting temperature vs. ADC curve when I combine the equations from steps 1 and 2. In order to calculate all values on the graph, the ATtiny84 would have to compute a natural log as well as floating point division. Since neither of those tasks are strong points for the 8-bit microcontroller, I looked to something that it is good at: memory look-up.
Reading from memory is fast, but in the case of the ATtiny84 it can still be resource expensive. The ADC on the chip returns a 10-bit value which can range from 0V to VCC. If I were to store the entire graph in a lookup table it would take 2048 bytes, which is 25% of the ATtiny's flash memory. Keep in mind that I am going to need some of that memory later on for character strings to generate menus. In order to make this task easier, engineers often use a technique called “function interpolation.”
The most common way of interpolating a function is to use line segment approximations of the original curve. In the image above (ADC to Temperature), the purple line is the theoretical temperature curve, and the green line shows the line segment approximation. I chose to quantize the graph by dividing the independent variable into 32 segments. Each segment can be represented as a straight line with a given slope and y-intercept. This helps combat the memory issue because now I just have to store two arrays with 32 elements each. The final implementation of the look-up table (LUT) will use 16-bit integers. This means that I will only use 128 bytes of flash in comparison to 2048 bytes if I were to store every value of the function.
Function interpolation drastically reduces memory resources, but as the image above shows, it does reduce accuracy in the non-linear regions. This imprecision can be avoided as long as we select a proper RS value that drives the linear portion of the curve within the selected temperature range (50-200ºF). There’s a spreadsheet document named ntc_thermistor_lut_generator.ods in the Resources section that contains all the calculations that I used to determine my values for the LUT. The spreadsheet allows you to use different thermistor characteristics as well as experiment with different RS values. It also generates the plot you see above, along with the percent error.
Step 4: Fixed Point Arithmetic
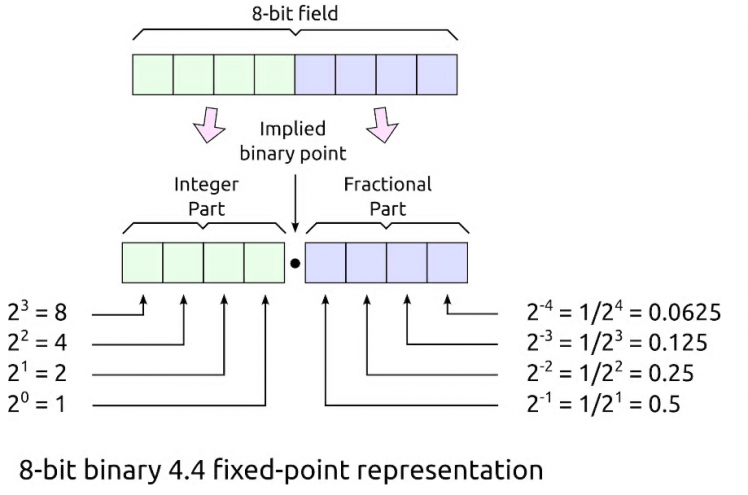
Representing integer numbers like 2, 5, and 17 in binary is simple. Conversely, what if you wanted to represent fractional values like 0.5 or 1.1?
To convert a binary number to decimal, we take the base value which is 2, and raise it to the current digit’s location from the radix point (radix being the general name for a decimal point). The same logic applies to digits to the right of the radix point, except now their exponent has to be negated. For instance, a 1 located two bits to the right of the binary point would have decimal value 2-2=1/22=1/4=0.25. The graphic above (8-bit binary 4.4 fixed point representation) shows this same calculation, but provides a more physical explanation than can be put into words. In the case of the pyrometer readout, we will have to make a decision as to how many bits of precision will provide sufficiently accurate data without excessive memory usage. The spreadsheet (=ntc_thermistor_lut_generator.ods) for the LUT in the Resources section contains a self-generated plot of the fixed point and interpolation error that is incurred throughout this process.
Step 5: Voltage Regulation
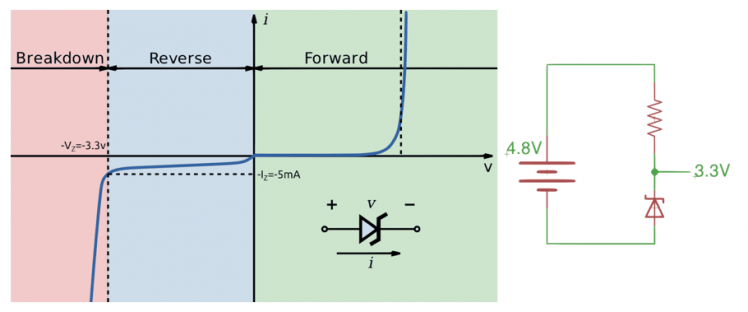
Since this device is battery powered, we need an efficient voltage regulator. The typical LM78xx series of linear voltage regulators simply wouldn't work since they require around 40% more voltage than their target output. I also didn't want to go with a switching power supply since that requires a high part count, and therefore higher cost. The next best regulating technique is to use a zener diode shunt regulator.
Zener diodes are device that are designed to operate quite efficiently in their break down region. A typical diode will start to build up heat once in the breakdown region, but a zener diode's characteristics allow it to hold the voltage at near constant. For this reason, a zener regulator is a perfect application for a power device. The only critical part to designing a good zener regulator, is to make sure that the diode is always operating in the breakdown region. This can be achieved by simply putting a resistor in series with the diode. The circuit in the figure above shows how the ideal voltage drop across the resistor will always be 1.5V. If I want at least 5mA of current to flow through the diode, then I just need to use ohms law to solve for the resistor value. Here, I used 10mA just to give myself a bit of wiggle room, and ohms law says R=1.5V/10mA=150Ω.
System Build Up
Now that the groundwork has been laid, it has to be implemented in programming, creation of the hardware circuit, and the final step of fitting it into an enclosure and testing it.
Step 6: Using the Look-Up-Table
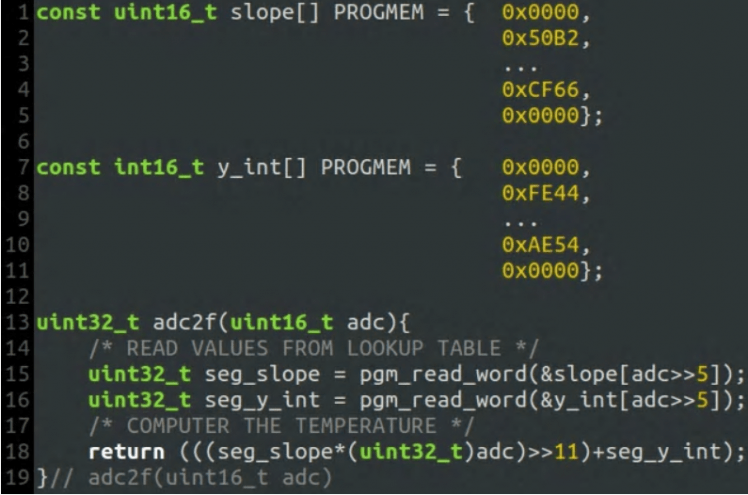
Now that we have the look-up table for these line segments, we need to write code that will use them to calculate the temperature. The process starts with the analog-to-digital converter measuring the voltage at THERM_VAL in the schematic diagram from step 2. The ADC will return a 10-bit value that we can use to index the array and find the given slope and y-intercept pair. To get this index, simply mask off the upper 5-bits from the ADC value, and use the found slope, y-intercept, and full ADC value to compute the temperature. It basically boils down to a single multiply and add operation in C code. The key thing to pay attention to in the function above, is the shift right 11 operation which keeps the binary points aligned as they are in the previous step.
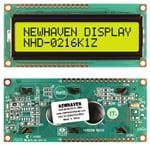
Step 7: Menu Interface
In order to navigate the pyrometer's many different options, I had to develop a well-structured menu system. Like most graphical user interfaces, I wanted a list of options to choose from, and also a method of “feedback” to show the user which item they have selected. With such a limited resolution display and a non-object oriented language, this task proved to be a bit challenging.
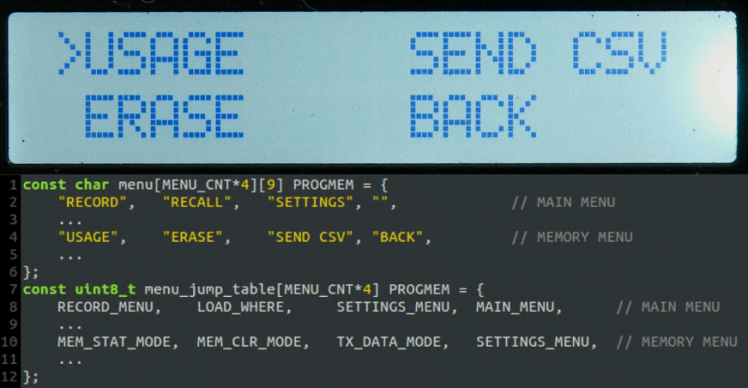
The first thing I designed was the overall layout of each menu page. Due to the limited screen dimensions, I chose to divide the display into 4 quadrants that would each contain a menu option. With this in place, having a pointer character next to the user's selection restricts each option to having a length of 9 characters. As the code snippet in the above image shows, each menu label is stored in a fixed length array with null strings placed where no option is provided. The second component to the menu system is a jump table with #defines that tell a switch case handler where to look to display the next menu page. For every label in the menu array, there must exist an element in the jump table. With this structure, it allows you to create an easily expandable menu system with a small memory footprint.
Step 8: Programming

There are plenty of tutorials out there that can explain the process much better than can be done here (links below). As I mentioned in my blog, I've been using an Arduino as a full blown AVR programmer for as long as I can remember (6 years). The benefit to this is that it costs absolutely nothing when using the free tools such as the AVRGCC compiler and the avrdude programmer. The code for this project can be downloaded from github, look for the link in the Resources section of this project. It contains all source files including the makefile needed to compile and program to the chip.
When using an Arduino as an ISP with avrdude, make sure to set the baud rate and programmer flags in the avrdude command line.
-c avrisp -b 19200
Sources
Arduino as ISP tutorial: http://www.instructables.com/id/Turn-Your-Arduino-Into-an-ISP/
Ladyada avrdude tutorial: http://www.ladyada.net/learn/avr/avrdude.html
Step 9: Assemble PCB
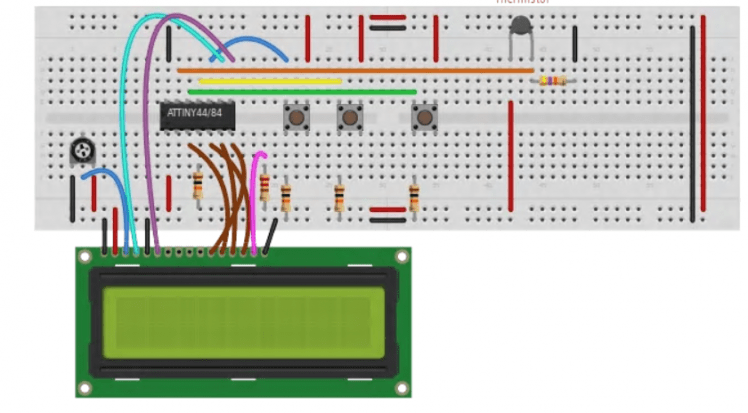
Once all the hardware and software has been finalized, it is time to set this project in stone... or solder. I chose to make a custom PCB since my university has a CNC isolation mill, but there are plenty of other options as well. Mouser sells PC prototyping boards that allow you to solder the component together with. The benefit to this (http://www.mouser.com/ProductDetail/BusBoard-Prototype-Systems/SB1660/?qs=sGAEpiMZZMtgbBHFKsFQgo04jOHntgNPR1pgBh9E9%252bI%3d) specific protoboard is that it has the exact same layout as a breadboard, so most of your circuit will be a direct crossover. All source project files are located in the Resources section so anyone can make the exact same board that I made.
Step 10: Building the Tire Probe
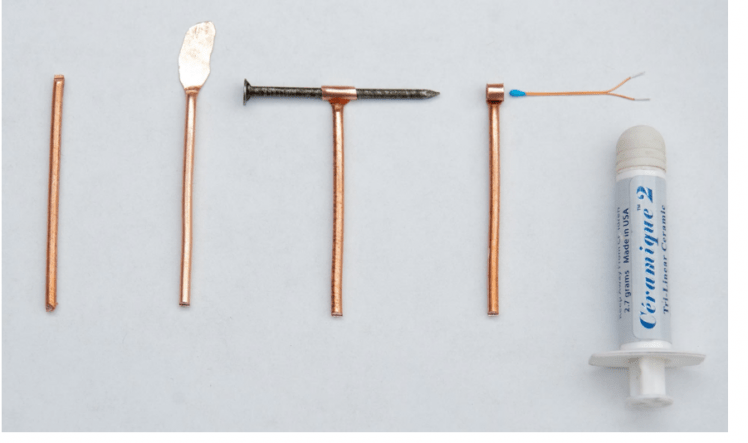
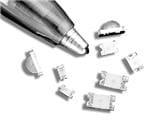
In order to measure the temperature of the tire properly, pyrometers usually use probes that have a sharp tip. This allows the thermistor to measure the internal temperature of the rubber, since the surface usually cools quite quickly. Considering that I can't put that much pressure onto the thermistor itself, I had to find a way to attaching some type of metal extension to it. I chose to use copper because it has a high thermal conductivity coefficient, and it is readily available.
To make the probe, I knew that I would have to make a good thermal bond between the thermistor and the probe material itself. After numerous attempts, I finally settled with the materials as shown above. I went into my scrap bin, and pulled out a few inches of 12AWG copper house wire. I then used a hammer to flatten one end of the wire until it was nearly paper thin (surprisingly easier than it sounds). Once I had the one end flattened, I used something similar in size to the thermistor to roll the copper tab into a hollow tube. I then used some sand paper to grind off the excess copper on the ends, and then filled the hollow tube with thermal paste. Lastly, I put some heat shrink tubing around the entire thing just to make sure that the thermistor and paste didn't fall out. This process resulted in a nearly continuous thermal connection from the tip of the copper to the thermistor itself.
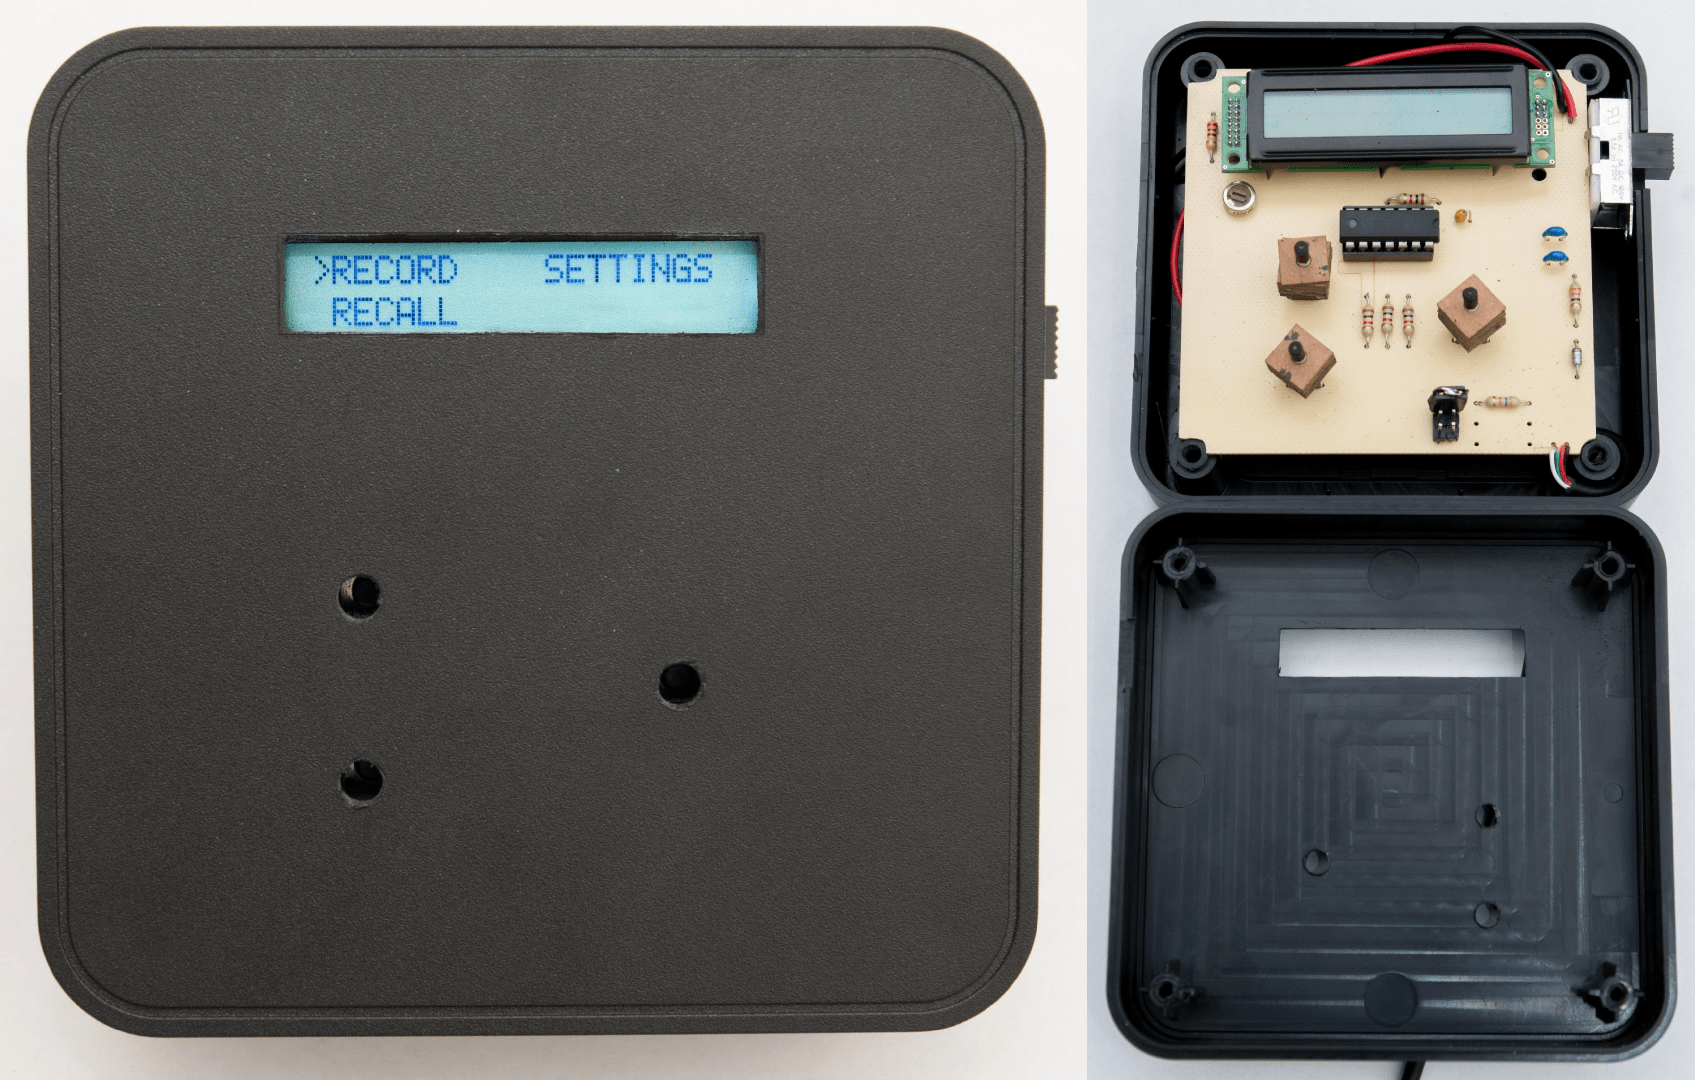
Step 11: Enclosure
The last step to this project is to put the pyrometer into some type of enclosure. When it comes to choosing an enclosure, I always focus on a few key features:
- Power source: placement, thermals, size, etc.
- Type of Material: How harsh is the environment?
- Dimensions
- PCB mounts
- Application-specific requirements
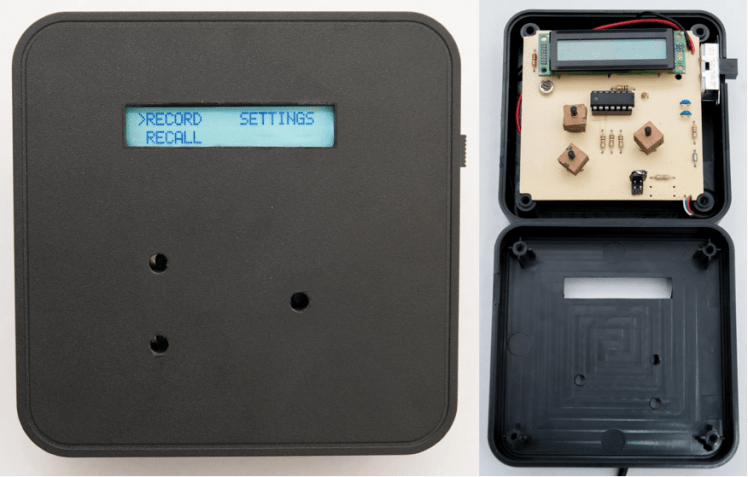
In the case of this project, I wanted the pyrometer to be powered by common household batteries: AA, AAA, or 9V. I decided to use AA batteries because they cost less than 9 volts, and I already have a bunch of rechargeable AAs. Picking a size for the enclosure was difficult because I had to choose something wide enough for the LCD, but I also didn’t want it to be too thick to hold comfortably in my hand. Next up is choosing a material. ABS plastic is typically a good choice because it is soft enough to cut with a dremel tool and small files. Lastly, I knew that I wanted some way of mounting the PCB inside the case. This enclosure used standoffs to suspend the board, but some enclosures use slots or grooves to hold a PCB. Mouser provides a wide variety of enclosures to choose from, so finding one that fulfilled all these requirements was a walk in the park.
Source Files and Downloads
Look-up Table Source file (Excel-compatible): ntc_thermistor_lut_generator.ods
User/Operating Manual: pyrometer user manual_rev1.pdf
Other:
This project does not include instructions for how to program the ATTINY84A-PU that is used in this project. There are many tutorials already for this microcontroller to of which can be found here:
Ladyada avrdude tutorial: http://www.ladyada.net/learn/avr/avrdude.html
Overview:
A tire pyrometer is a common tool within the racing community. The concept is simple, it's a device that measures tire temperatures thereby allowing the driver to tune for optimal traction. The goal of this project was to make a low cost alternative to some of the more costly commercial devices on the market. I knew there wasn't much to it and that I could reproduce a similar product for a fraction of the cost.
The pyrometer measures the temperature of a tire. The copper probe is jabbed into the tire itself, between the treads. The idea is that the probe tip should be about 1/16"-1/8" embedded into the rubber for good heat conduction. As long as tires are not extremely worn, then there should be plenty of rubber (1/4"-3/8") before you would poke through and puncture the tire. Some basic theory on how the components work will lay the ground work for System Build Up.
Step 1: Thermistor Theory
Thermistors are devices that change their electrical characteristic in response to temperature. Like the name suggests, resistance is the main characteristic that is dependent to temperature with these devices. Thermistors are very common in temperature applications because they provide high accuracy at a low cost.
Most thermistors follow an exponential relationship between resistance and temperature. The graph above shows the difference between a negative and positive coefficient thermistor; often abbreviated NTC and PTC. The main difference between the two being that NTC shows an inverse R-T relationship and the PTC shows a direct relationship. For this project I chose an NTC thermistor for a wider temperature range and also because they tend to be a bit cheaper.
The equation above will produce the exact R-T curve for a Vishay NTC thermistor. Note the constants B and R25 within the equation; these values are specific for each thermistor. The R25 is the resistance of the thermistor at 25ºC. B has units of Kelvin (temperature), and relates to how quickly the graph drops off. Both of these values will be given to you in the component's datasheet. Keep in mind T is in units of Kelvin which is simple to convert from Celsius since Kelvin=Celsius+274.15. We will use these values and the RT equation in the next step to make some plots and tables to help us read the temperature with the microcontroller.
Step 2: Thermistor Reading Technique
So we have this component that reacts to temperature, but how do we actually read it using a microcontroller? The basic concept is called a voltage divider, and it uses the idea of series resistors having the same current.
he voltage divider is a very common circuit, found in almost all electronic designs. Any time two resistors are in series with one another, the voltage over one will always have a ratio of the total voltage over the pair. In our case we are using the fact that the thermistor resistance RT will be varying; therefore, the voltage drop over RS will change accordingly. This is similar to a potentiometer except a potentiometer allows full range to either VCC or GND because one of the two resistors can drop to nearly 0Ω. In our case, we can't “sweep” all the way to GND because of the constant RS value. The equation above shows how we can determine the voltage over RS as a function of RT.
The nice thing about this equation is that we can physically measure VRS using the ATtiny84's built in analog-to-digital converters (ADC). Once we have that, it's simple enough to solve for RT and use the equation from step 1 above, Thermistor Theory, to find our temperature. The only problem is that a microcontroller isn't good at doing complex math, so we have to use an alternative method of calculating the result.
Step 3: Function Interpolation (approximation)
The graph above is the resulting temperature vs. ADC curve when I combine the equations from steps 1 and 2. In order to calculate all values on the graph, the ATtiny84 would have to compute a natural log as well as floating point division. Since neither of those tasks are strong points for the 8-bit microcontroller, I looked to something that it is good at: memory look-up.
Reading from memory is fast, but in the case of the ATtiny84 it can still be resource expensive. The ADC on the chip returns a 10-bit value which can range from 0V to VCC. If I were to store the entire graph in a lookup table it would take 2048 bytes, which is 25% of the ATtiny's flash memory. Keep in mind that I am going to need some of that memory later on for character strings to generate menus. In order to make this task easier, engineers often use a technique called “function interpolation.”
The most common way of interpolating a function is to use line segment approximations of the original curve. In the image above (ADC to Temperature), the purple line is the theoretical temperature curve, and the green line shows the line segment approximation. I chose to quantize the graph by dividing the independent variable into 32 segments. Each segment can be represented as a straight line with a given slope and y-intercept. This helps combat the memory issue because now I just have to store two arrays with 32 elements each. The final implementation of the look-up table (LUT) will use 16-bit integers. This means that I will only use 128 bytes of flash in comparison to 2048 bytes if I were to store every value of the function.
Function interpolation drastically reduces memory resources, but as the image above shows, it does reduce accuracy in the non-linear regions. This imprecision can be avoided as long as we select a proper RS value that drives the linear portion of the curve within the selected temperature range (50-200ºF). There’s a spreadsheet document named ntc_thermistor_lut_generator.ods in the Resources section that contains all the calculations that I used to determine my values for the LUT. The spreadsheet allows you to use different thermistor characteristics as well as experiment with different RS values. It also generates the plot you see above, along with the percent error.
Step 4: Fixed Point Arithmetic
Representing integer numbers like 2, 5, and 17 in binary is simple. Conversely, what if you wanted to represent fractional values like 0.5 or 1.1?
To convert a binary number to decimal, we take the base value which is 2, and raise it to the current digit’s location from the radix point (radix being the general name for a decimal point). The same logic applies to digits to the right of the radix point, except now their exponent has to be negated. For instance, a 1 located two bits to the right of the binary point would have decimal value 2-2=1/22=1/4=0.25. The graphic above (8-bit binary 4.4 fixed point representation) shows this same calculation, but provides a more physical explanation than can be put into words. In the case of the pyrometer readout, we will have to make a decision as to how many bits of precision will provide sufficiently accurate data without excessive memory usage. The spreadsheet (=ntc_thermistor_lut_generator.ods) for the LUT in the Resources section contains a self-generated plot of the fixed point and interpolation error that is incurred throughout this process.
Step 5: Voltage Regulation
Since this device is battery powered, we need an efficient voltage regulator. The typical LM78xx series of linear voltage regulators simply wouldn't work since they require around 40% more voltage than their target output. I also didn't want to go with a switching power supply since that requires a high part count, and therefore higher cost. The next best regulating technique is to use a zener diode shunt regulator.
Zener diodes are device that are designed to operate quite efficiently in their break down region. A typical diode will start to build up heat once in the breakdown region, but a zener diode's characteristics allow it to hold the voltage at near constant. For this reason, a zener regulator is a perfect application for a power device. The only critical part to designing a good zener regulator, is to make sure that the diode is always operating in the breakdown region. This can be achieved by simply putting a resistor in series with the diode. The circuit in the figure above shows how the ideal voltage drop across the resistor will always be 1.5V. If I want at least 5mA of current to flow through the diode, then I just need to use ohms law to solve for the resistor value. Here, I used 10mA just to give myself a bit of wiggle room, and ohms law says R=1.5V/10mA=150Ω.
System Build Up
Now that the groundwork has been laid, it has to be implemented in programming, creation of the hardware circuit, and the final step of fitting it into an enclosure and testing it.
Step 6: Using the Look-Up-Table
Now that we have the look-up table for these line segments, we need to write code that will use them to calculate the temperature. The process starts with the analog-to-digital converter measuring the voltage at THERM_VAL in the schemat
Schematics, diagrams and documents
Code
Credits
Mouser Electronics
Mouser Electronics is a online distributor of electronic components based in Mansfield, Texas, United States.
Related products


Leave your feedback...