
Senso
Made by Arduino / Environmental Sensing / Garden / IoT
About the project
Senso is a device that detects deforestation using sound analysis detecting machines used to cut down trees and warning the authorities
Project info
Difficulty: Moderate
Platforms: Arduino
Estimated time: 1 day
License: GNU General Public License, version 3 or later (GPL3+)
Story
ABOUT THIS PROJECT
Overview
Deforestation is one of the most significant problems our generation faces across the world. Deforestation is directly linked to climate change as burning down organic material releases a lot of carbon dioxide, a greenhouse gas. Forests are cut down throughout the world to make space for agricultural fields and housing. Intentional fires are put to clear out the forest and illegal logging happens on an international scale.
Logging is a big concern in both developing and developed countries. This happens a lot in Romania. Although logging is regulated in Romania, a lot of the industry is done illegally. Romania accounts for 65% of Europe's virgin forests but they are rapidly going away, cut down. Most of the cutting is done using chainsaws, which emit a lot of noise.

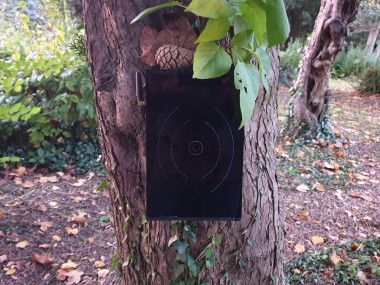
A picture i happened to take
This is where Senso comes in, Senso is a low-powered device that is equipped with a sound analysis module that can isolate different bands of sound. The device is programmed to identify the sound of a logging machinery such as a chainsaw and alert relevant authorities when this happens. The device takes samples every 15 minutes, if an anomalous sound is detected, the device will send an event to the backend where the areas where logging took place are illustrated on a map.
With Senso, illegal logging can be combatted as authorities can be instantly alerted when logging takes place allowing them to take action faster than ever before concentrating their forces on areas where logging is most prominent.
Images
Video
Device Overview
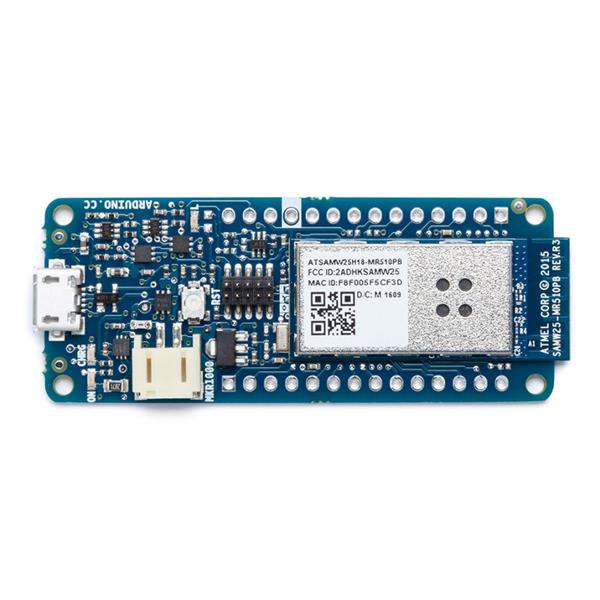
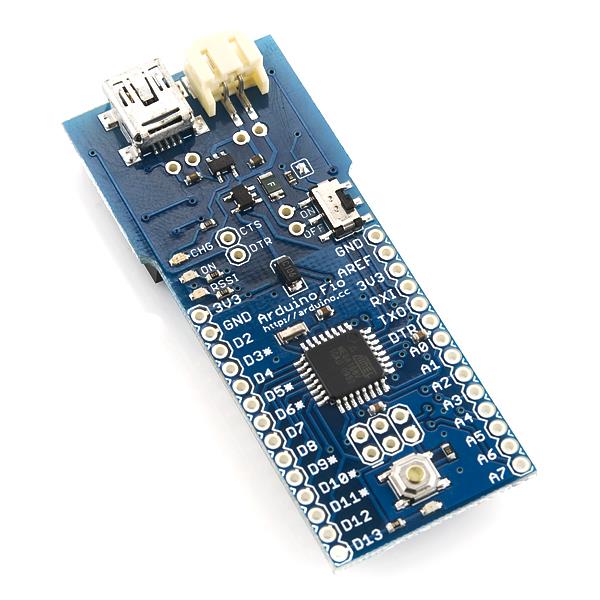
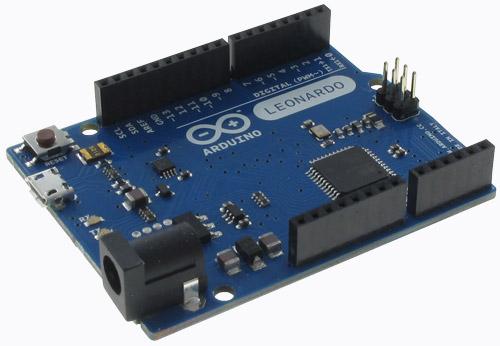
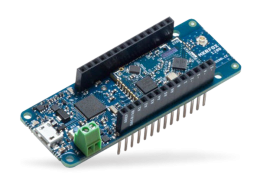
I will be using the Arduino MKR Fox for this project. I have previously used it in a bunch of projects that rely on low-power communication due to its great low-power functionalities. It is very easy to use SigFox on this device as it is built in and Arduino libraries allow you to get up and running in no time.
In this case, I have decided to power the device through a breadboard power supply with 5v as the modules attached would drain too much power if powered by the device.
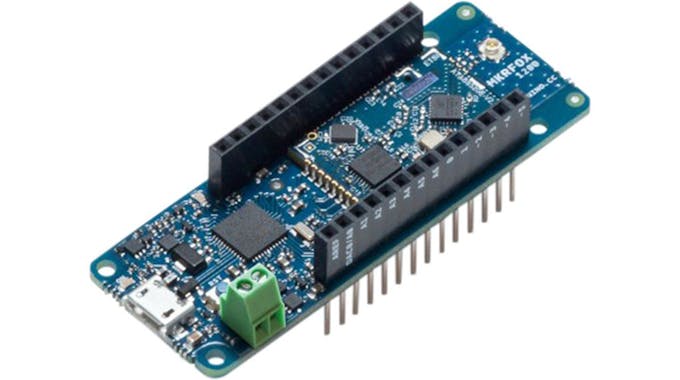
The MKR Fox
As this is a prototype, the battery life of the product is not long enough for function on the field. I am still working on turning the sensors off when the device is in sleep mode to preserve the battery.
Project Architecture
The product is split into a frontend and a backend. The frontend consists of the device on the field taking samples and the backend consists of the SigFox, Azure and Power Bi ends which process and display the data. Below is a diagram illustrating the process.
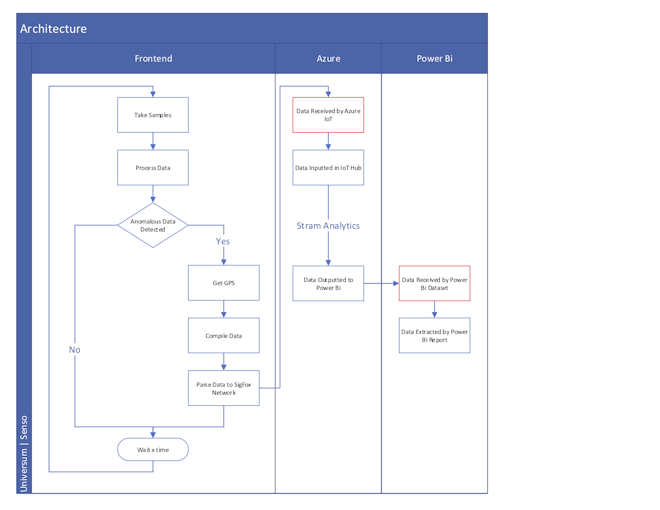
Project Architecture
Frontend
The device will wake up at defined intervals of time, it will then sample its audio analysis module 400 times getting the values of critical bands of sound. It will look out for sounds on specific bands on which chainsaws and similar machines operate. Using a mathematical calculation, it will compare the bands with each other isolating the sound of the chainsaw.
If the samples return a positive match to a chainsaw, the device will get its current location and its battery level sending these values to the cloud. The device will then go to sleep for the defined time.
A function that could be added on would be creating a tracker out of the device. The device could detect when the tree has been cut down using accelerometers turning the device into a tracker afterwards. The device could send its location to the backend every 10 minutes allowing the authorities to track the shipment
Backend
The event is received by the SigFox backend, it is forwarded to Azure IoT through a callback function. Azure IoT then assigns the data to a hub, a data streaming service queries the data and inserts it into a Power Bi dataset. Finally Power Bi extracts the data from the dataset creating a report. All the data is then displayed on a report.
Going further, a messaging application could be invoked to send an SMS to the authorities whenever an event is received by the backend. This would allow forestry workers to be able to know exactly where to go when a tree is cut down
Constructing the Project
Enough talk, let's start building the project.
Step 1: Required Materials
This project requires quite a lot of components. The list below summarises the components required for the project. The links to the components are included in the BOM above.
- Arduino MKR Fox
- Breadboard
- GPS Module
- Antenna, GPS
- Antenna, GSM
- Breadboard Power Supply Stick 5V/3.3V
- 9V battery
- DFRobot Audio Analyser Module
- Microphone
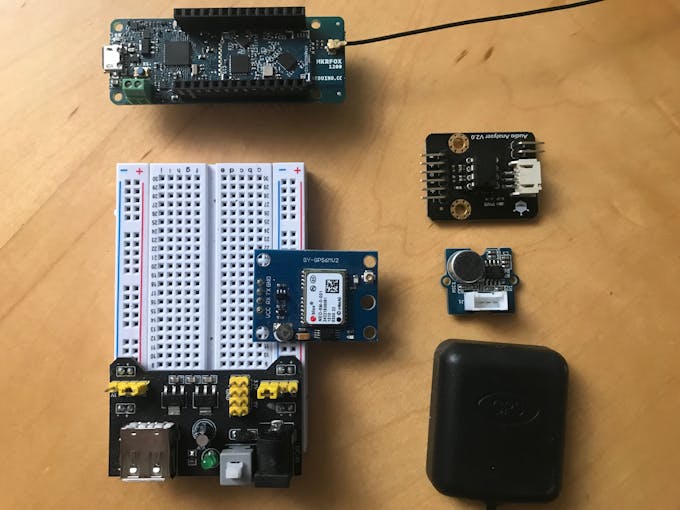
The components
Step 2: Connecting the Circuit
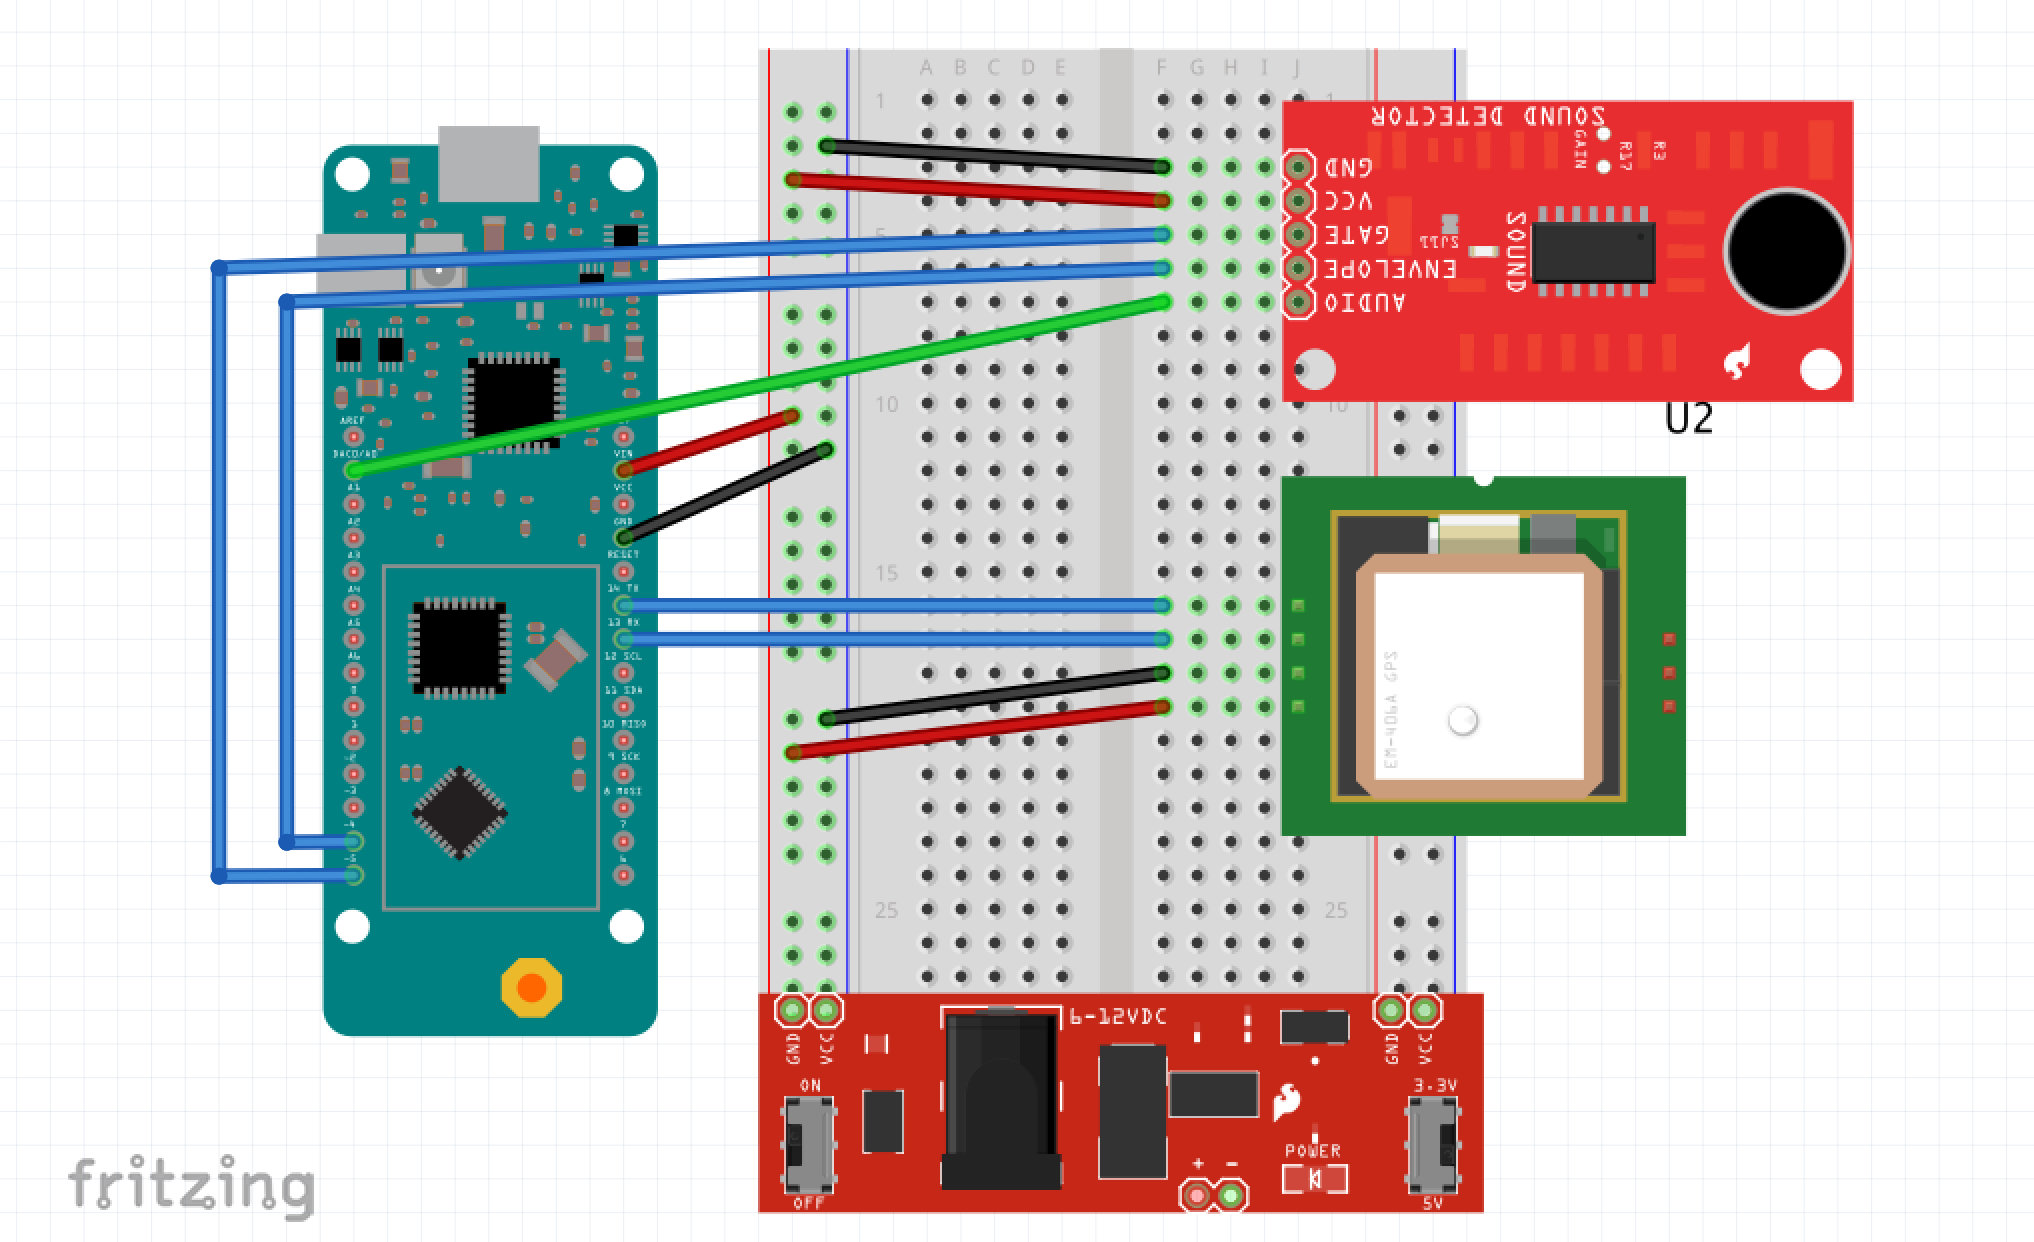
This is a little tricky as we will be using the breadboard power supply. This means that we have to power the micro controller with the power. Below are the Fritzing schematics of the circuit. A downloadable version is attached at the end of the project.

The schematics
The images below illustrate the steps taken to wire the project in case you are confused.
Let's start with the device
Step 3: Acknowledging the Code
The code is split into 3 main sections, each of these is described below:
- Get and process Sound
- Get GPS and battery
- Send Data to SigFox
Get and process Sound
- bool processData()
- {
- Serial.println("Processing Data");
- Serial.println("________________________________________");
- Serial.println("Getting Samples");
- Serial.println(" OK - Setting Up");
- bool anomaly[nrSamples]; // 6 samples will be taken of 100 reads
- Serial.println(" OK - Taking Samples");
- for(int y = 0; y < nrSamples; y++)
- {
- long valueMean[7] = {0, 0, 0, 0, 0, 0, 0}; // final data mean
- long avg[7] = {0, 0, 0, 0, 0, 0, 0}; // add data together to get mean
- for(int i = 0; i < 100; i++) // take 100 samples
- {
- int rawFreq[7]; // array for data
- long refinedFreq[7]; // array of refined data
- for(int a = 0; a < 7; a++)
- {
- rawFreq[a] = 0;
- refinedFreq[a] = 0;
- }
- Audio.ReadFreq(rawFreq); // get the frequencies
- // process the analogic data
- for(int a = 0; a < 7; a++)
- {
- refinedFreq[a] = max((rawFreq[a]-100),0);
- }
- // add the refined data to the variables
- for(int a = 0; a < 7; a++)
- {
- avg[a] += refinedFreq[a];
- }
- delay(20);
- }
- // get the mean of all the values
- for(int i = 0; i < 7; i++)
- {
- valueMean[i] = (avg[i] / 100);
- }
- long comparison = ((valueMean[0] + valueMean[1] + valueMean[2] + valueMean[3]) / 1.9);
- if(valueMean[5] > comparison)
- {
- anomaly[y] = true;
- }
- else
- {
- anomaly[y] = false;
- }
- }
- Serial.println(" OK - Checking Samples");
- // check if at least 2 of the samples signalled anomalies
- int anomalyNr = 0;
- for(int i = 0; i < nrSamples; i++)
- {
- if(anomaly[i] == true)
- {
- anomalyNr++;
- }
- }
- Serial.print(" OK - Samples detected with anomanies: "); Serial.println(anomalyNr);
- if(anomalyNr > 1)
- {
- Serial.println(" Success - Sending Warning Message");
- Serial.println("________________________________________");
- Serial.println("");
- return true;
- }
- else
- {
- Serial.println(" Success - All Values are Normal");
- Serial.println("________________________________________");
- Serial.println("");
- return false;
- }
- }
This section of code is executed when the device wakes up. The device will first take the samples of data from the sound sensor and will then process the data by comparing the value of the target frequency to the other frequencies. This is done in the following line of code.
- long comparison = ((valueMean[0] + valueMean[1] + valueMean[2] + valueMean[3]) / 1.9);
- if(valueMean[5] > comparison)
The mean of all bands except for the target one are added and divided by 1.9. If the value of the target band is bigger than the comparison, the sample is positive.
Get GPS and Battery
- bool getGPS()
- {
- while(Serial1.available() > 0)
- {
- if(gps.encode(Serial1.read()))
- {
- if(gps.location.isValid() && gps.time.isValid() && gps.date.isValid() && (gps.location.lat() != 0) && (gps.location.lng() != 0))
- {
- return true;
- }
- else
- {
- return false;
- }
- }
- }
- if(millis() > 10000 && gps.charsProcessed() < 10)
- {
- Serial.println("Error - GPS Module Responded with Error");
- Serial.println(" Terminating Code");
- Serial.println("________________________________________");
- while(1) {};
- }
- }
- // only gets voltage id powered through terminals
- void getBatteryVoltage()
- {
- analogReadResolution(10);
- analogReference(AR_INTERNAL1V0);
- int sensorValue = analogRead(ADC_BATTERY);
- float batteryVoltage = sensorValue * (3.25 / 1023.0);
- dataUnion.data.battery = batteryVoltage;
- }
- void extractGPS()
- {
- dataUnion.data.geoLat = gps.location.lat();
- dataUnion.data.geoLng = gps.location.lng();
- }
These functions extract the GPS co-ordinates from the module and verify that they are correct. They then get the battery voltage of the attached battery (if a battery is directly attached to the device).
Note that if the device is powered through VIN the battery voltage will be equal to 0 - the device must be powered through the terminals to display the voltage. To do this, connect the power pins on the breadboard to the terminals on the device.
Send Data to SigFox
- bool sendToSigFox()
- {
- Serial.println(" OK - Getting Values to Compile");
- Serial.println(" OK - Sending Data");
- Serial.print(" --> OUTPUT ");
- for(int i = 0; i < 12; i++)
- {
- Serial.print(dataUnion.bytes[i], HEX);
- }
- Serial.println("");
- delay(100);
- SigFox.beginPacket();
- SigFox.write(dataUnion.bytes, HEX);
- Serial.println(" Success - Data is Sent");
- Serial.println("");
- }
- void encodeData(float sigLat, float sigLng, float sigBattery)
- {
- Serial.println(" OK - Encoding Data");
- Serial.print(" --> INPUT ");
- Serial.print(sigLat, 6); Serial.print(", ");
- Serial.print(sigLng, 6); Serial.print(", ");
- Serial.println(sigBattery);
- Serial.print(" --> OUTPUT ");
- for(int i = 0; i < 12; i++)
- {
- Serial.print(dataUnion.bytes[i], HEX);
- }
- Serial.println("");
- }
These functions will encode the data in byte format and will then send it to the SigFox backend.
Setting up the Variables
There are two variables that have to be edited.
proDebug set to true if debugging. The device will need a serial connection and the serial monitor open to run the code if set to true. Set to false otherwise.
nrSamples will define the number of samples to take. Each sample consists of 100 readings.
Step 5: A bit on the modules
I am using a cheap GPS module I found on Amazon for €10. It is easy to use though it takes a bit of a while to lock onto satellites. A good antenna will be needed.
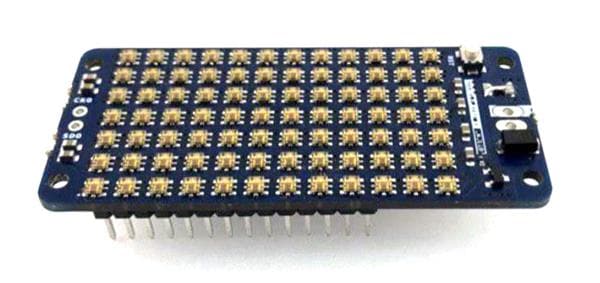
The focus on this section is on the audio analyser module from DF Robot. It basically collects the sound level of the 7 most prominent bands: 63Hz, 160Hz, 400Hz, 1kHz, 2.5kHz, 6.25kHz and 16kHz. After rigorous testing I was able to identify that a chainsaw was typically in the 2.5kHz 6.25kHz range. When testing with the sensor, the 6.25kHz band would spike up when playing the sound of a chainsaw.
I was then able to come up with a calculation that would prevent other machinery such as cars and natural sounds from being recognised as a chainsaw. Although not perfect, it does a great job at rejecting similar sounds.
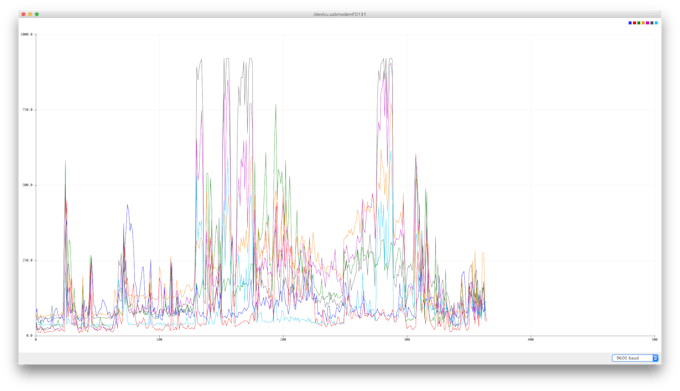
Sound testing - the spikes show chainsaw activity
Step 6: Preparing Azure
This project will use Microsoft Azure as a backend. I am aware that most people will prefer AWS but honestly, I am a fan of Azure. There are a few prerequisites.
- Have an Azure Account
- Have an Azure subscription
- Basic knowledge of the application
This step will go through setting up the account and the IoT hub that will store our data received from the device.
Step 7: Preparing SigFox
Next we need to prepare the SigFox callback, for this there are a couple of prerequisites:
- A SigFox backend account
- The device registered in the backend
The values that should be inserted into the fields are displayed below. Place the following in the cutom-data-config field
- geoLat::float:32:little-endian geoLng::float:32:little-endian battery::float:32:little-endian
Here we are basically telling the backend what data we are sending, defining that we are sending 3 floats, latitude, longitude and battery level.
Next we want to fill the JSON body of the message with the following data.
- {
- "device" : "{device}",
- "data" : "{data}",
- "latitude" : {customData#geoLat},
- "longitude" : {customData#geoLng},
- "battery" : {customData#battery},
- "time" : {time},
- "duplicate" : {duplicate},
- "snr" : {snr},
- "station" : "{station}",
- "avgSignal" : {avgSnr},
- "lat" : {lat},
- "lng" : {lng},
- "rssi" : {rssi},
- "seqNumber" : {seqNumber}
- }
This defines the values that we want to send on to Azure.
Step 8: Stream Analytics Setup
The next step is to set up the job that will query data from the IoT hub and push it into a Power Bi dataset. Prerequisites.
- Complete all steps above
- SELECT
- latitude as latitude,
- longitude as longitude,
- battery as battery,
- System.Timestamp AS Timestamp
- INTO
- [OutputToPowerBI]
- FROM
- [InputFromIOTHub]
Step 9: Upload Code
Now we have to upload the code to test the connection, ensure that the stream analytics job is running and then upload the code to the device. Simulate a chainsaw sound on your phone and make the device send an event to the cloud. You should see the graphs on your dashboard shifting after you sent the data. This indicates that the data is received and you can move on.
If the event is not plotted on any of the graphs, you should start debugging with the SigFox backend and then work your way towards Azure.
Step 10: Setting Up Power Bi
We will now set up Power Bi, note that a business account is needed to assign a Power Bi subscription in Microsoft, hopefully you have access to one. Otherwise, there are plenty of alternatives that you can use. Prerequisites:
- A Power Bi Account
- All the steps done before
Step 11: Enclosure
So now that we have finished setting up the application we need to create an enclosure for the project. I have decided to tie the device to a tree and make it camouflaged to catch the loggers by surprise. Make sure to have the microphone outside the enclosure so it can pick up the sounds.
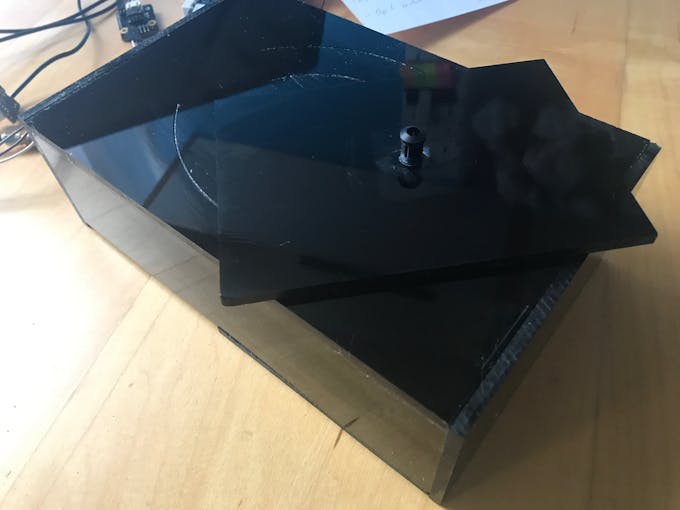
I had something like this
Background
I went to Romania this summer and climbed some hills. Everyone seemed mad about illegal logging and I though that there is something that I can do about it. So I looked at the problem and thought of a new approach to it. I decided to identify logging by the sound of the machinery cutting down trees, an array of devices implanted in the forest that would look out for chainsaws and alert the authorities when trees are being cut down was my solution.
I hope that countries will be able to stop illegal deforestation through the use of IoT solutions, I think that Senso is a start to finding cheap solutions to combat climate change one step at a time.
CODE
CUSTOM PARTS AND ENCLOSURES
Enclosure Schematics
SCHEMATICS
File
Schematics, diagrams and documents
CAD, enclosures and custom parts
Credits
Related products


Leave your feedback...