
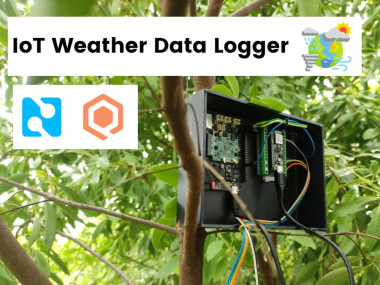
Iot Weather Data Logger Using Blues Wireless& Qubitro
Made by pradeeplogu0 / Environmental Sensing / Weather
About the project
This guide will help you to build an IoT-based weather data logger using the Blues Wireless Notecard and Notecarrier.
Project info
Difficulty: Moderate
Platforms: Arduino, Seeed Studio, Blues Wireless
Estimated time: 1 hour
License: GNU Lesser General Public License version 3 or later (LGPL3+)
Items used in this project
Hardware components

Story
As worldwide temperatures rise, monitoring environmental conditions has never been more important.

Data from https://earthobservatory.nasa.gov/
Environmental data can be tracked in a variety of ways. You may utilize wired devices, an SD card in a controller for manually capturing sending back data, or you can use Wi-Fi or BLE communication-based controllers to handle this task.
Consider if you don't have time to manually retrieve data from an SD card, or if your devices aren't in Wi-Fi or Bluetooth connection range, how are you going to keep track of your weather data?
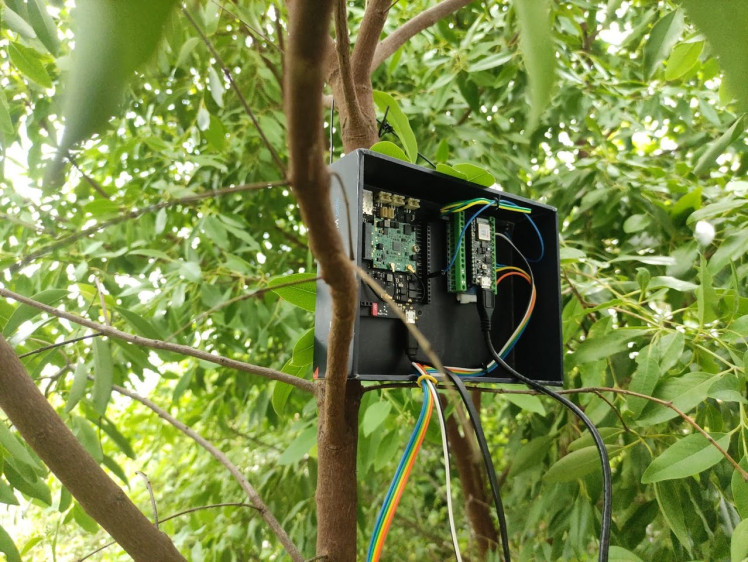
In this tutorial, I'll show you how to create an IoT-based weather data recorder using Blues Wireless hardware modules; no SD card, Wi-Fi, or BLE are required. Simply connect the Blues Notecard and Notecarrier to the controllers to track your weather data.
Things that you need:
Hardware:
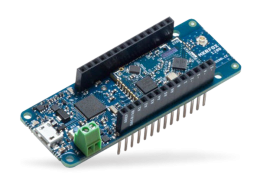
- LTE-M Notecard Global
- Notecarrier A with LiPo, Solar, and Qwiic Connectors
- Arduino Nano 33 BLE Sense
- DHT11 Temperature Sensor
- Rain Sensor
- Seeed Air Quality Sensor
- Seeed Light Sensor
Software:
Structural Outline:
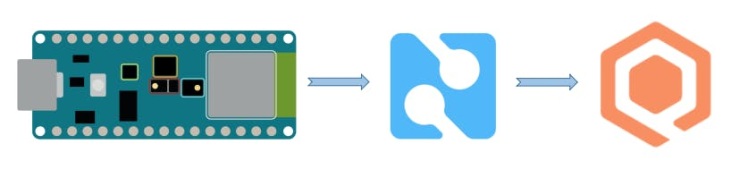
This whole tutorial will follow these three steps:
Step 1: Hardware Setup
The first step is to collect environmental data, so we will use an DHT11, a rain sensor, an air quality sensor, and a light sensor to do so. An Arduino Nano 33 BLE Sense is connected to all the sensors, which will act as a controller for processing the data.
Step 2: Notehub Setup
Data collected from sensors will be sent to the Blues Notehub cloud using a Blues Notecard and Blues Notecarrier.
Step 3: Qubitro Setup
As soon as our sensor data reaches the cloud, we are going to use Qubitro to visualize and post-process it.
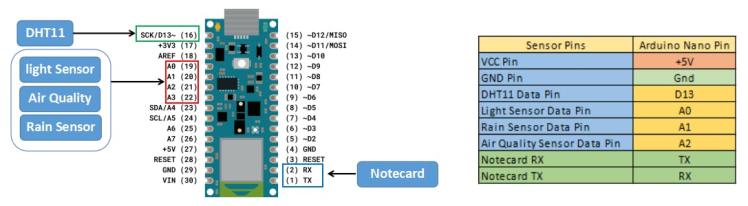
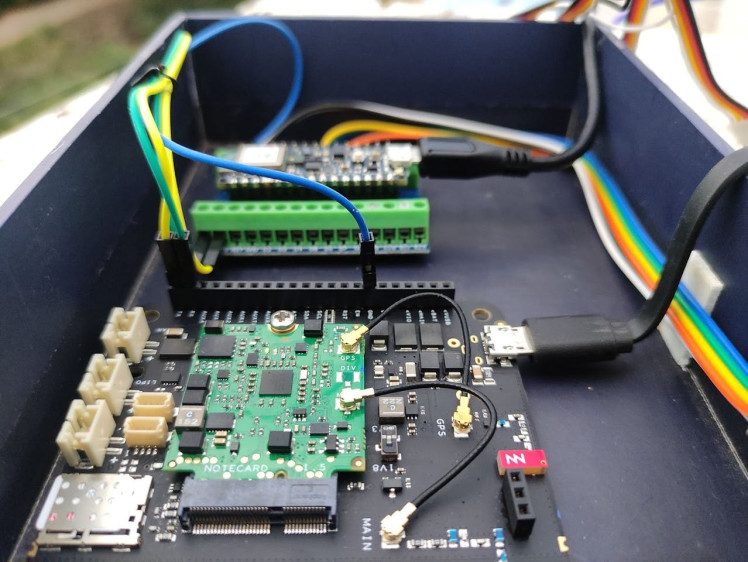
Hardware Setup:
All sensors except the DHT11 are analog. Connect DHT11 to D13 of Arduino Nano 33 BLE Sense and connect A0 to A2 of Arduino Nano 33 analog pins directly.
Now that your sensors are all connected, let's move on to the programming part. To do so, open the Arduino IDE and compile the code below. It will collect all the sensor data and output it to the serial monitor.
#include "Air_Quality_Sensor.h"
#include <DHT.h>

String Stage;

AirQualitySensor sensor(A1);       //Analog pin A1 for Air Quality sensor
#define DHTPIN 13                  //Digital pin 13 for DHT11 sensor
#define DHTTYPE DHT11

DHT dht(DHTPIN, DHTTYPE);

void setup(void) {

  dht.begin();                        // Init DHT11
  Serial.println("Waiting sensor to init...");
  delay(10000);

}
void loop(void) {

  int quality = sensor.slope();

  Serial.print("AQ Sensor value    : ");
  Serial.println(sensor.getValue());
  Serial.print("Pollution Level    : ");

  if (quality == AirQualitySensor::FORCE_SIGNAL) {
    String Stage = "ERROR!";
    Serial.println(Stage);
  }
  else if (quality == AirQualitySensor::HIGH_POLLUTION) {
    String Stage = "High pollution!";
    Serial.println(Stage);
  }
  else if (quality == AirQualitySensor::LOW_POLLUTION) {
    String Stage = "Low pollution!";
    Serial.println(Stage);
  }
  else if (quality == AirQualitySensor::FRESH_AIR) {
    String Stage = "Fresh air!";
    Serial.println(Stage);
  }

  float h = dht.readHumidity();
  Serial.print("Humidity Level     : ");
  Serial.print(h);
  Serial.println(" %");

  // Read temperature as Celsius (the default)
  float t = dht.readTemperature();
  Serial.print("Temperature Level  : ");
  Serial.print(t);
  Serial.println(" C");

  int value = analogRead(A2);       //Analog pin A2 for Light sensor
  float valuel = map(value, 0, 800, 0, 100);
  Serial.print("Light Sensor Level : ");
  Serial.print(valuel);
  Serial.println(" %");

  int rainSensor = analogRead(A3);  //Analog pin A3 for Rain sensor
  float rainSensor1 = map(rainSensor, 0, 1024, 0, 100);
  Serial.print("Rain Sensor Level  : ");
  Serial.println(rainSensor);
  Serial.print("Dry level          : ");
  Serial.print(rainSensor1);
  Serial.println(" %");
  Serial.println("------------------------------------------------");
  delay(10000);

}
The next step is to set up your Blues Notecarrier. Attach the Notecard to the Notecarrier (I'm using an external sim card, so I'll explain how to do that). Connect the Notecarrier to your PC via a micro USB cable.
[You can take a detailed look at the setup on the following URL - https://dev.blues.io/quickstart/notecard-quickstart/notecarrier-a/, If you hit any issues getting up and running, you can reach out for help on the Blues Forum.]
If you want to use an external SIM like I am (Airtel), additionally follow these steps to configure your Notecard.
# disable the cellular modem on the Notecard
{"req":"hub.set","mode":"off"}

# set the Airtel APN
{"req":"card.wireless","mode":",airtelgprs.com"}

# make sure the Notecard cloud host is set to the default (if you changed it)
{"req":"hub.set","host":"a.notefile.net"}

# enable the cellular modem (minimum requires explicit sync requests)
{"req":"hub.set","mode":"minimum"}

# force a sync (if it hasn't started already)
{"req":"hub.sync","allow":true}
Now we'll try out the Blues Notecarrier. I'm using Python to send some dummy data to Notehub.
import json
import notecard
import serial
import time

productUID = "com.gmail.pradeeplogu26:env_data_logger" #Change this with yours

# Select Serial
use_uart = True
card = None
# Configure the serial connection to the Notecard
serial = serial.Serial('COM7', 9600)                  #Change this with your COM port

card = notecard.OpenSerial(serial, debug=True)
req = {"req": "hub.set"}
req["product"] = productUID
req["mode"] = "continuous"
card.Transaction(req)

while True:
    temp = 10
    humidity = 20
    print('Temperature: {} degrees C'.format(temp))
    print('Humidity: {}%'.format(humidity))
    req = {"req": "note.add"}
    req["file"] = "sensors.qo"
    req["start"] = True
    req["body"] = {"temp": temp, "humidity": humidity}
    card.Transaction(req)
    time.sleep(15)
Just rename the projectUID and the Com port to yours and hit run. You can see the dummy data in the terminal.
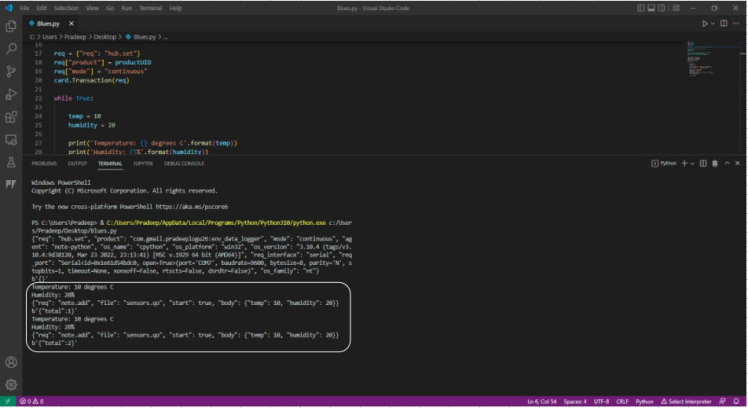
This script will return with the above response. Next, open up the Notehub dashboard and navigate to the “Events” tab and see the data.
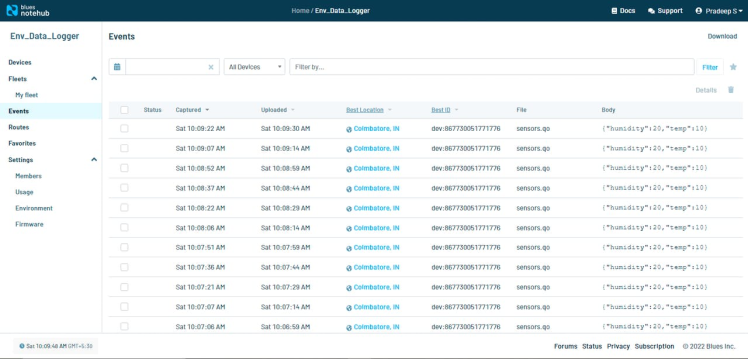
You can see the data which are sent by the Python script inNotehub, If you are done with this step you can connect the Blues Notecard and Notecarrier to Arduino Nano 33 BLE Sense by using the UART port.
[The Blues Notecarrier supports both I2C and UART communication]
After the connections have completed just compile the below Arduino code in the Arduino IDE, This will send the sensor data to Notehub.
#include <Notecard.h>
#include "Air_Quality_Sensor.h"
#include <DHT.h>
AirQualitySensor sensor(A1); //Analog pin A1 for Air Quality sensor
#define DHTPIN 13 //Digital pin 13 for DHT11 sensor
#define DHTTYPE DHT11
DHT dht(DHTPIN, DHTTYPE);
#define txRxPinsSerial Serial1
#define productUID "xxxxxxxxxxxxxxxxxxxx"
Notecard notecard;
String Stage;
void setup(void) {
notecard.begin(txRxPinsSerial, 9600);
J *req = notecard.newRequest("hub.set");
JAddStringToObject(req, "product", productUID);
JAddStringToObject(req, "mode", "continuous");
notecard.sendRequest(req);
delay(1000);
dht.begin(); // Init DHT11
Serial.println("Waiting sensor to init...");
delay(10000);
}
void loop(void) {
int quality = sensor.slope();
Serial.print("AQ Sensor value : ");
Serial.println(sensor.getValue());
Serial.print("Pollution Level : ");
if (quality == AirQualitySensor::FORCE_SIGNAL) {
String Stage = "ERROR!";
Serial.println(Stage);
}
else if (quality == AirQualitySensor::HIGH_POLLUTION) {
String Stage = "High pollution!";
Serial.println(Stage);
}
else if (quality == AirQualitySensor::LOW_POLLUTION) {
String Stage = "Low pollution!";
Serial.println(Stage);
}
else if (quality == AirQualitySensor::FRESH_AIR) {
String Stage = "Fresh air!";
Serial.println(Stage);
}
float h = dht.readHumidity();
Serial.print("Humidity Level : ");
Serial.print(h);
Serial.println(" %");
// Read temperature as Celsius (the default)
float t = dht.readTemperature();
Serial.print("Temperature Level : ");
Serial.print(t);
Serial.println(" C");
int value = analogRead(A2);
float valuel = map(value, 0, 800, 0, 100);
Serial.print("Light Sensor Level : ");
Serial.print(valuel);
Serial.println(" %");
int rainSensor = analogRead(A3);
float rainSensor1 = map(rainSensor, 0, 1024, 0, 100);
Serial.print("Rain Sensor Level : ");
Serial.println(rainSensor);
Serial.print("Dry level : ");
Serial.print(rainSensor1);
Serial.println(" %");
J *req = notecard.newRequest("note.add");
if (req != NULL) {
JAddStringToObject(req, "file", "sensors.qo");
JAddBoolToObject(req, "sync", true);
J *body = JCreateObject();
if (body != NULL) {
JAddNumberToObject(body, "temperature", t);
JAddNumberToObject(body, "humidity", h);
JAddNumberToObject(body, "air quality value", sensor.getValue());
JAddNumberToObject(body, "light intencity", valuel);
JAddNumberToObject(body, "rain sensor", rainSensor);
JAddNumberToObject(body, "dry level", rainSensor1);
JAddItemToObject(req, "body", body);
}
notecard.sendRequest(req);
}
Serial.println("------------------------------------------------");
delay(10000);
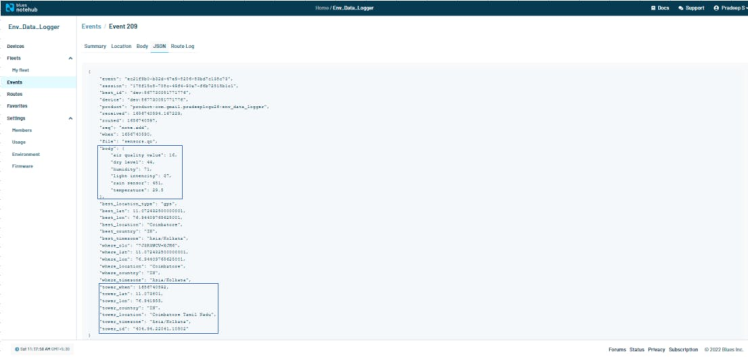
}Just open up the serial monitor and look at the outputted data. Next, move to the “Events” tab in the Notehub dashboard.
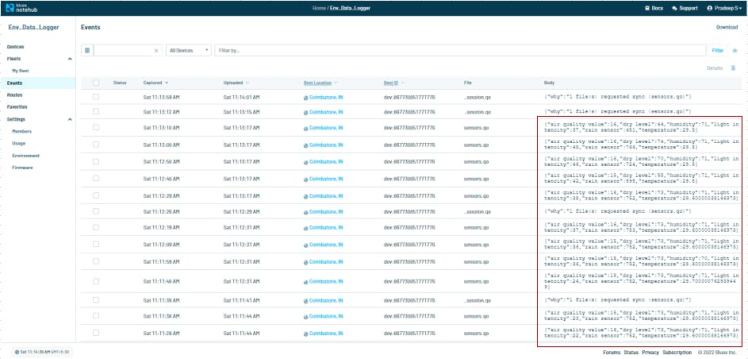
There you can see our sensor data.
At this point, you are we done with the hardware part. You can click on the JSON data and analyze the whole data that was sent by our Blues hardware.
Next, let’s move to the Notehub integrations.
Notehub Setup:
We sent our data to Notehub, so now we need to visualize the data with some graphs and tables. Let’s look at how to do this with Qubitro cloud.
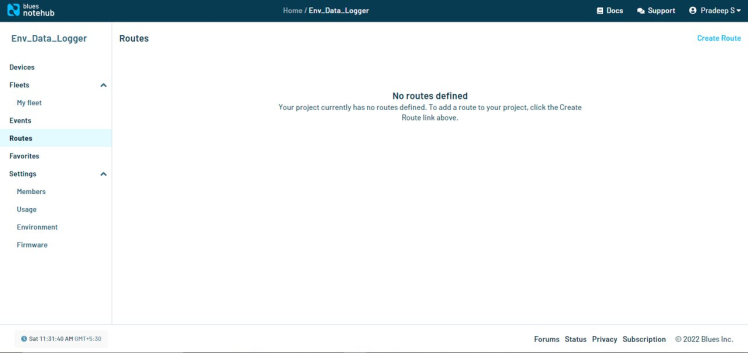
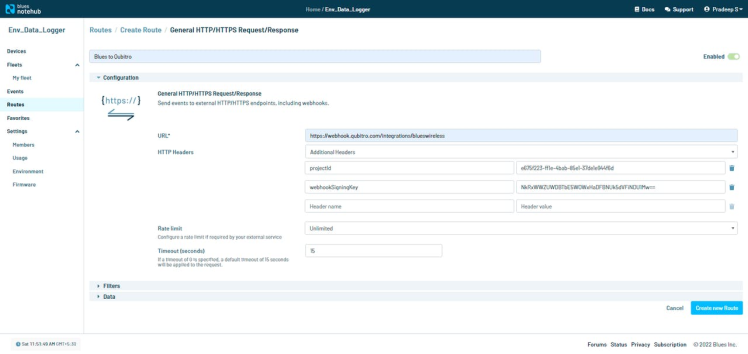
First, open up Notehub and navigate to the “Routes” tab, then create a new route.
Then select the integration type as HTTP/HTTPS.

Now we have to enter some information about our “Qubitro Route”.

Enter the name as you want and enter the URL as “https://webhook.qubitro.com/integrations/blueswireless”, then click on headers, choose additional headers, and enter the 2 headers as shown in the image below.
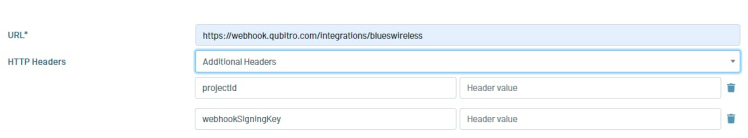
[Note: The header values will be added in next step]
Qubitro Setup:
In this step, we are going to set up the project in Qubitro. To start, open up https://portal.qubitro.com/, sign in with your credentials, and create a new project. You don’t need to add any devices.
Next, navigate to the project settings and copy the “Project ID”.
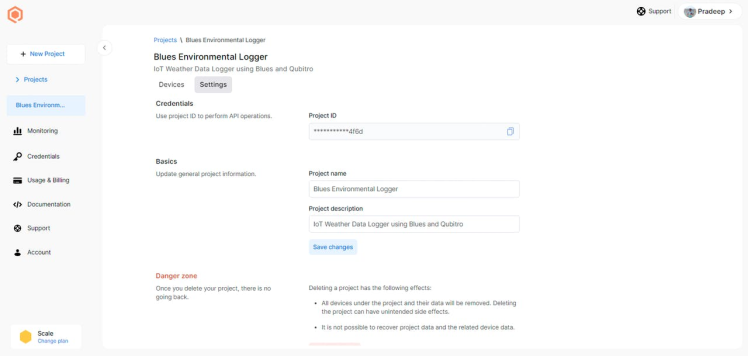
Then navigate to the credentials tab in the Qubitro portal and copy the “Webhook sign-in key”. Take these and enter them back in the Blues Notehub’s route header.
Once you complete the whole setup, click on “Create new route”, which will add the new route in your Notehub.
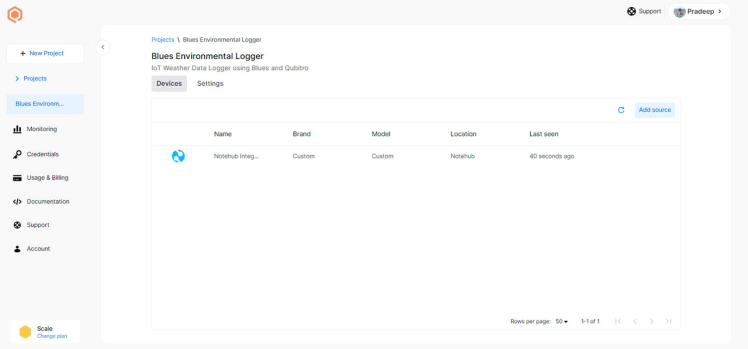
Now you can see your Blues device in the Qubitro portal.
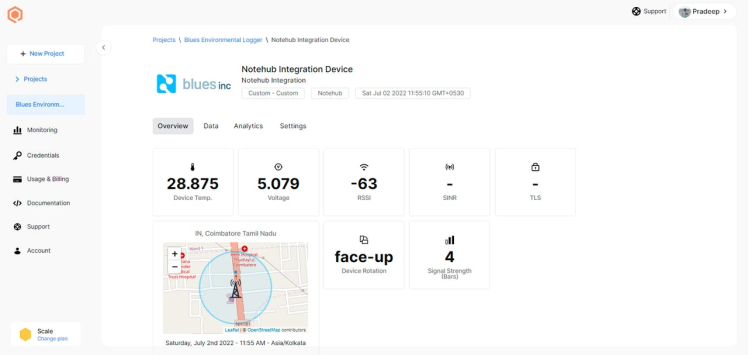
Just open the device and see the incoming data. Qubitro automatically extracts the data from Blues. In the overview tab you can see the current location, voltage and orientation of the hardware.
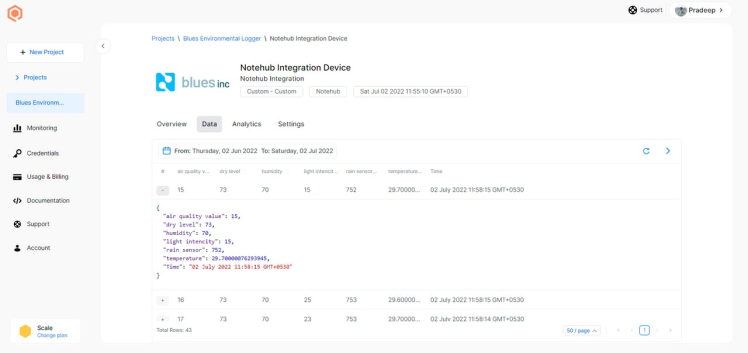
Next open up the Data tab, as here you can see your sensor data.
Now we are going to do some visualization, which you can do by opening the Monitoring tab and adding some widgets.
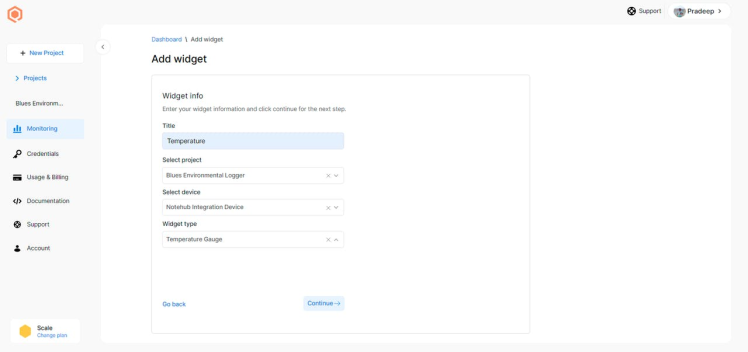
Similarly, add widgets to all the data. Here is my sample dashboard.

Finally, we got to visualize our sensor data in graphs and charts.
Now that our IoT based Weather Data Logger is almost complete, we are in the final and most important step. How about data sharing with other users in a mobile app or web application ? Qubitro allows APIs to share the cloud data with multiple platforms and languages.
To try it out, open up the Credentials tab in the Qubitro portal and copy the API key.
Then open this URL https://qubitro-api.readme.io/reference/getdevice, which will ask you to complete some inputs.
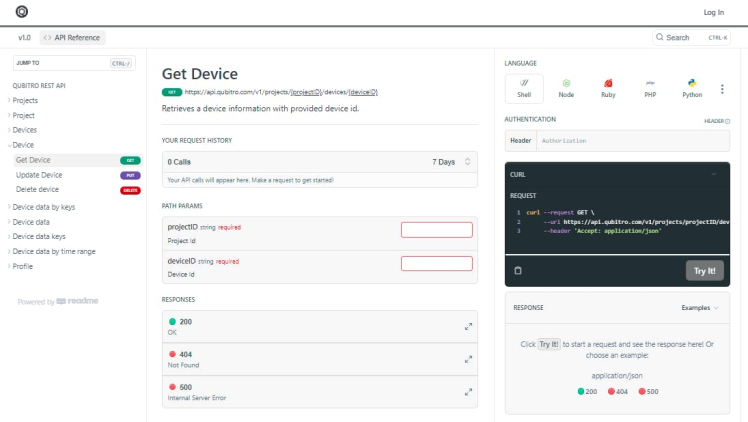
Enter the API key in the “Bearer-API Key” format, enter the Device ID and Project your used in the Qubitro Project setup, and then click on the “Try It” button. You can see your whole data from your Blues hardware.
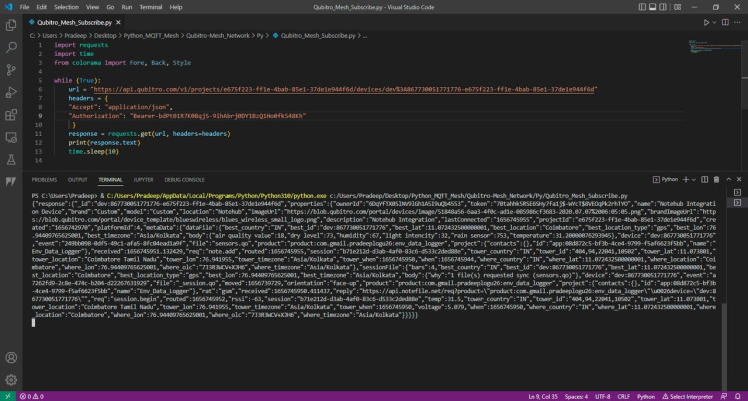
Let’s make a simple Python script to get the API response. Just copy the below Python script and change the keys, then execute.
import requests
import time
from colorama import Fore, Back, Style

while (True):
    url = "https://api.qubitro.com/v1/projects/e675f223-ff1e-4bab-85e1-37de1e944f6d/devices/dev%3A867730051771776-e675f223-ff1e-4bab-85e1-37de1e944f6d"
    headers = {
    "Accept": "application/json",
    "Authorization": "Bearer-xxxxxxxxxxxxxxxxxxxxxxxx"
    }
    response = requests.get(url, headers=headers)
    print(response.text)
    time.sleep(10)
It will return the data from the hardware.
So now you can share your Blues weather logger’s data to external world.
Conclusion:
In this tutorial, I have shown you how to build your own IoT-based weather data logger with Blues hardware modules, and explained how to share that data with the external world. Now you can track your weather data without a wire, Wi-Fi, or SD cards.
Schematics, diagrams and documents
Code
Credits
Related products


Leave your feedback...