





PicoScope 2205A Guide: Specs, Setup and Practical Projects
Your code says a pin should be switching. Your multimeter shows a voltage. Neither tells you exactly what that signal looks like over time. An oscilloscope helps bridge that gap, letting you investigate timing, waveform shape and the relationship between signals.
The PicoScope 2205A takes a PC-based approach. Instead of adding another screen to your workbench, it connects to your computer over USB and uses PicoScope software for control and analysis. The linked Electromaker package includes probes, giving you a starting point for exploring your circuits.
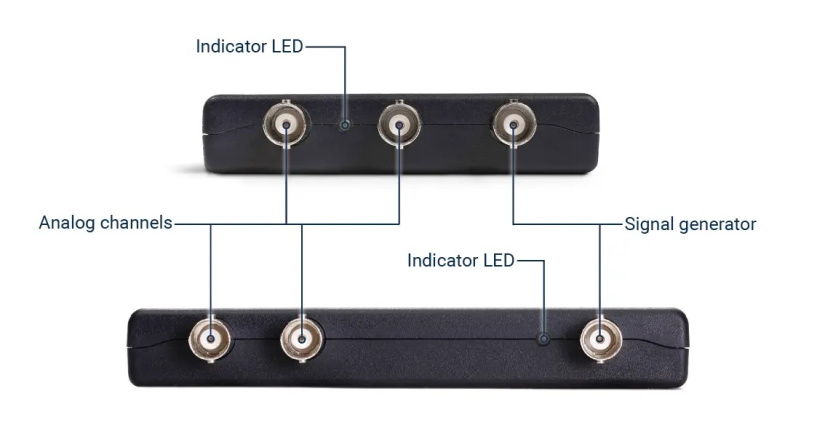
Its appeal is straightforward: a compact instrument that combines waveform capture with software analysis and a built-in signal generator. The important question is whether its bandwidth, channel count and capture memory match the work you need to do.
PicoScope 2205A Specifications at a Glance
The table below covers the standard two-channel 2205A. It does not describe the 2205A MSO or the higher-bandwidth 2000B models.
| Specification | PicoScope 2205A |
|---|---|
| Analog inputs | 2 channels |
| Analog bandwidth | 25 MHz at -3 dB |
| Native vertical resolution | 8 bits |
| Maximum real-time sampling | 200 MS/s with channel A alone. 100 MS/s per channel with both channels active. |
| Block capture memory | 16 kS, shared between active channels |
| Input ranges | Nine ranges from ±50 mV to ±20 V |
| Input coupling | AC or DC |
| Function generator frequency | 0.1 Hz to 100 kHz, plus DC output |
| Connection and power | USB 2.0, powered from USB |
Source: Pico Technology's current PicoScope 2000 Series datasheet. Sampling figures are maximum values, not guaranteed settings for every capture configuration.

Why Choose a PC-Based Oscilloscope?
A USB oscilloscope changes how you work with measurements. Your computer becomes the display, control panel and place to store results. That can be convenient when your code editor, circuit documentation and project notes are already open on the same machine.
PicoScope 7 provides configurable waveform views, spectrum analysis and serial protocol decoding. Software updates and the included serial decoders do not require separate paid licenses. You can arrange the interface around the task rather than the dimensions of a built-in instrument screen.
The trade-off is dependence on a computer. Consider where your laptop will sit, how you will reach the controls while holding a probe, and whether you prefer mouse-driven operation or physical knobs. A small instrument does not automatically mean the complete setup takes less space.
What Can You Use the PicoScope 2205A For?
The following are suggested applications, not results from hands-on testing. They work best as focused experiments where you already know roughly what signal to expect.
Check PWM and Timing Signals
A useful first task is comparing a microcontroller's intended output with its measured output. Generate a repetitive pulse signal, capture it, and inspect the period and high time. Then change your firmware settings and compare the captures.
For example, you could investigate whether an LED dimming routine changes duty cycle without changing frequency. Another exercise is comparing a control signal with a related low-voltage response. These experiments help you connect software settings with electrical behavior.
Keep the distinction between timing and edge detail in mind. Seeing that a pulse occurs at the expected interval does not prove that the instrument has captured every detail of its rising edge.
Investigate I2C Communication
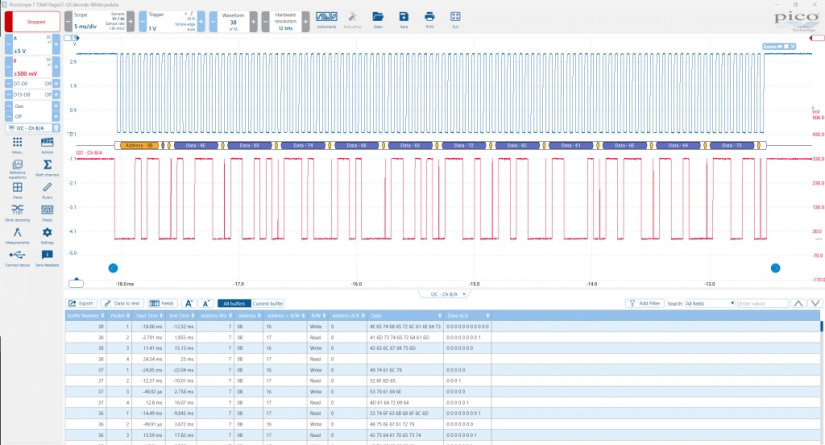
I2C is a useful two-channel exercise because it uses a clock line and a data line. PicoScope's I2C decoder lets you assign those signals and view decoded information alongside the waveforms.
Start with a short, repeatable transaction to a sensor. Inspect the clock and data traces before relying on the decoded bytes. Check that the capture contains the complete transaction and that the decoder's thresholds suit the observed voltage levels.
This gives you two perspectives on the same event: the data exchanged and the electrical signals carrying it. That is more informative than treating a missing response as a software problem alone.
Explore Audio and Filter Circuits
The built-in generator suggests a simple learning project: apply a low-amplitude sine wave to a passive filter and compare its input and output. Change the frequency and observe how the relationship changes.
For an RC low-pass filter, place one channel at the input and the other at the output. Begin with a high-impedance load and a safely powered circuit. Record your settings so you can repeat the experiment after changing a component.
The 2205A generator has a 600-ohm output impedance. That means the connected load can affect the voltage delivered to your circuit. Measure the actual input signal rather than assuming the generator setting is the voltage your circuit receives. Pico lists this characteristic in its signal generator specifications.
Understand the Limits Before You Buy
Bandwidth Is Not the Same as Maximum Digital Clock Speed
According to Pico's bandwidth explanation, a scope's bandwidth is the frequency where a sine wave is displayed at about 70.7% of its actual amplitude. It is not a promise of unchanged measurement accuracy right up to that frequency.
Fast edges also contain frequency components above a signal's repetition rate. A digital waveform can therefore demand more bandwidth than its clock frequency initially suggests.
For the 2205A, the practical question is not simply whether your signal is below 25 MHz. Ask whether you need to measure its overall timing, its amplitude accurately, or its detailed edge shape. Those are different requirements.
Capture Memory Determines How Much Detail You Can Keep
Memory depth becomes important when you want to capture a long event and then zoom into a small part of it. The basic relationship is:
Capture duration = samples retained per channel ÷ sampling rate per channel.
Using the published single-channel limits, roughly 16,000 samples at 200 million samples per second represents about 80 microseconds. This is an illustrative calculation, not a measured capture result.
To record a longer interval within the same memory, you need fewer samples per second. That can be entirely reasonable for a slow signal, but it reduces the detail available for fast events. Triggering close to the event of interest helps you use the available record efficiently.
Streaming mode transfers data to the computer for longer acquisitions, but it is a different mode with different speed limits. It should not be confused with continuously recording at the headline block-mode sampling rate.
Software Resolution Enhancement Does Not Change the ADC
PicoScope offers resolution enhancement, which uses digital filtering to improve the visibility of small voltage changes. It can add up to four bits of effective resolution, but the hardware remains an 8-bit acquisition system.
The trade-off is reduced high-frequency detail. That can help when examining a slowly changing signal, but it can also hide behavior you are trying to investigate. Start with the raw waveform, then apply enhancement deliberately.
Serial Decoding Does Not Add Physical Channels
PicoScope supports protocols including UART, I2C and SPI through its serial decoding tools. However, software support does not remove the need to capture the required signals.
The standard 2205A has two analog inputs, not a separate bank of digital inputs. A task requiring clock, chip select and both data directions cannot be captured fully at once with two channels. Choose your instrument around the signals you need to observe together.
Getting Started with the PicoScope 2205A
Begin with a known, low-voltage signal rather than an unknown circuit. This makes it easier to distinguish an instrument setup problem from a fault in the circuit.
- Install the software. Use Pico's download selector and choose the 2205A. Follow the installation instructions before connecting the instrument.
- Connect the scope. Use the supplied USB cable and confirm that the software detects the device.
- Check the probe configuration. Match the physical probe's attenuation setting to the software setting. Check compensation when using a switchable passive probe in its 10:1 position.
- Capture a known signal. Choose a voltage range that contains the waveform, adjust the time scale to show a few cycles, and set an edge trigger within the signal's voltage swing.
The PicoScope 2000 Series user's guide covers installation and connection. Pico also provides a separate guide to compensating 10:1 probes.
For a repeatable first exercise, use a modest-amplitude, low-frequency output from the built-in generator. Capture it, save the settings, change one parameter and observe the difference. Avoid changing several controls at once while learning the interface.
USB Power Does Not Mean Electrical Isolation
The 2205A's measurement ground connects through USB. Do not treat its probe grounds as independently floating connections or attach them to unrelated circuit potentials.
Do not connect the scope directly to mains or other hazardous live voltages. Overvoltage protection is not a usable measurement range, and running a laptop on battery does not make this an isolated, safety-rated measurement system.
Follow the grounding and input-limit instructions in the manufacturer's safety guidance. Keep beginner experiments to suitable low-voltage circuits.
Practical Questions from the PicoScope Community
Discussions in r/PicoScope include audio measurements, software workflows and longer recording sessions. The community covers multiple product families, so a solution for another PicoScope should not automatically be treated as a verified 2205A procedure.
Can You Measure Audio Voltage with RMS?
One community question about audio testing asks whether RMS measurements can serve a similar purpose to an AC voltmeter.
The important distinction is which RMS quantity you select. Total RMS includes the DC component. AC RMS, also described as RMS ripple, measures the variation around the signal's average. Pico explains the difference in its RMS measurement guide.
For your own test, define whether you need the AC signal level or the combined AC and DC value. Check the probe scaling and capture interval before interpreting the number. The presence of an RMS function alone does not establish equivalence to a particular calibrated meter.
Can You Record for Long Periods?
A recording discussion involving a PicoScope 6000 highlights a broader concern: long acquisitions depend on the computer and file-saving workflow, not just the instrument.
For a 2205A project, first decide whether you need a continuous record or separate triggered captures. Then test a short session using the intended settings. Check the saved data, available storage and computer power settings before leaving a longer session running.
For custom acquisition workflows, PicoSDK provides instrument drivers and programming resources. It is a route to automation, not a way to bypass hardware sampling or memory limits.
Does It Work with Windows, macOS and Linux?
Pico's 2205A-specific downloads currently list PicoScope 7 for Windows and macOS, plus Linux software and drivers. The Windows and Mac listings include x64 and ARM64 packages.
Use that model-specific page to check the current options for your computer. Older documentation may describe PicoScope 6 or earlier platform support, so it should not be your only reference for a new installation.

Is the PicoScope 2205A Right for Your Projects?
The 2205A is worth considering when your work centers on focused, two-channel measurements and you are comfortable using a computer as the instrument interface. Suggested starting points include PWM experiments, short I2C transactions and low-voltage audio or filter investigations.
Give memory depth particular attention. When your task combines a long capture window with fine timing detail, bandwidth alone is not enough to judge suitability. Likewise, count the signals you must observe simultaneously before assuming two inputs will cover the job.
The strongest reason to choose this scope is a match between its capabilities and your actual measurements. Start with a clear question about your circuit, check the required bandwidth, voltage range and record length, and choose accordingly.
View the PicoScope 2205A with probes at Electromaker for current pricing and availability.

Residing on the south coast of England, Rich has spent the last few years building Electomaker.io from the ground up. He is usually found behind a laptop coordinating the rest of the EM team and occasionally finding time to contribute articles to the blog. When not tapping away at a laptop, he can be found either paddleboarding, at the beach, playing golf (badly), or camping with his family.













Leave your feedback...