
Weather Station With Epaper And Raspberry Pi

Made by sridhar_rajagopal / Displays / Weather / IoT
About the project
In this article, I explain how I created a tabletop weather station with ePaper display, a Raspberry Pi, and a ProtoStax enclosure.
Project info
Difficulty: Easy
Platforms: Raspberry Pi
Estimated time: 1 hour
License: GNU General Public License, version 3 or later (GPL3+)
Items used in this project
Hardware components


Story
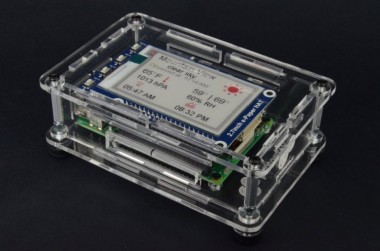
1 / 4 • Weather station on display by my nightstand!

Weather station on display by my nightstand!

Weather Station

Weather Station

Weather Station
In this article, I explain how to build a weather station with an ePaper display (like the kind you find on a Kindle, except this one is tri-color - white, black and red) and a Raspberry Pi and put it in an enclosure so that you have a finished project that you can display on your coffee table or night stand and see the weather information for your location (or locations) of choice!
For the weather data, I use Open Weather Map, a cloud service that offers a Weather API and that has a free tier plan available. It even has a Python wrapper library available to easily invoke the APIs and get the weather data in an object oriented manner, without worrying about underlying protocols and processing JSON results.
For the ePaper display, I use an ePaper HAT for the Raspberry Pi by Waveshare, who also provide a python library for interfacing with it.
Lastly comes the enclosure. Some of you may be aware that I've created a new stackable, modular enclosure system called ProtoStax. It was a personal itch that I had to scratch - I wanted an enclosure that supported different stages of prototyping, offering protection and open access when starting out, with the ability to add side walls and the top later, but also have the ability to stack multiple units either side-by-side or one on top of the other, thereby having the ability to expand with prototyping needs and the addition of other boards and components.
In this example I use ProtoStax for Raspberry Pi B+, a clear acrylic enclosure for the Raspberry Pi B+ that is also stackable and modular and has room comfortably for the ePaper Display HAT. It is clear and sturdy and also has rubber feet to slightly elevate it and protect the surface of your table or nightstand, so you can display your weather station and have it easily accessible by your nightstand or coffee table to get the weather information to plan your day! ?
You can, of course, use any Raspberry Pi, compatible ePaper display or enclosure and just use the code in this project.
Ok, let's get started!
Step 1 - Mount the Raspberry Pi B+ to the Enclosure Base Plate
Let us first mount the Raspberry Pi to the enclosure's base plate. This gives it protection while offering full open access to it to configure and setup the RPi and play around with it. When you are ready to close it up, It is easy to add the side walls and top plate and secure everything with screws.
Mount the Raspberry Pi to the base plate, and add feet and other hardware to prepare the enclosure in Platform Configuration. See steps below in the slideshow - the caption for each image is numbered and gives additional explanation for each step.
1 / 9 • 1. Start with Base Plate

1. Start with Base Plate

2. Use PCB mounting spacers

3. Place Raspberry Pi on PCB mounting spacers
")
4. Screw in RPi to Base Plate (Base plate mounting holes are threaded)

5. Prepare Rubber Feet - insert hex nuts into the bottom of rubber feet

6. Place Washers on top of Rubber Feet

7. Place Base Plate with Raspberry Pi on top of Washers and Rubber Feet

8. Place Spacers on Base Plate over the holes aligned with the Feet

9. Screw in Lower Bracing Element into the Feet to finish Platform Configuration for open access
Here are all the steps as an animated gif:
All the steps in a single animated gif. See details in the slideshow above

All the steps in a single animated gif. See details in the slideshow above
Step 2 - Plug the Waveshare ePaper HAT into the Raspberry Pi
Next step is to plug the Waveshare ePaper HAT into the Raspberry Pi. Its female header fits into the GPIO pins of the Raspberry Pi. It comes with standoffs to attach it more firmly to the Raspberry Pi. Since we are using it inside a protected enclosure, this step is not necessary and I skipped it. Reuse the standoffs for any later projects! ?
Plug ePaper display into Raspberry Pi GPIO port

Plug ePaper display into Raspberry Pi GPIO port
Step 3 - Configure the Raspberry Pi
The ePaper display uses SPI for communication. We therefore need to enable SPI on the Raspberry Pi, if you haven't already done so.
Steps to Enable SPI
Launch raspi-config. Go to "Interfacing Options". Navigate to SPI and press enter. Say yes when asked if you would like the SPI interface to be enabled. See steps below in the slideshow - the caption for each image is numbered and gives additional explanation for each step.
1 / 4 • 1. Navigate to "Interfacing Options" in raspi-config and press enter

1. Navigate to "Interfacing Options" in raspi-config and press enter

2. Navigate to SPI and press enter

3. Say yes to enable SPI interface.

4. Your SPI interface is now enabled
Next, we will need to install the necessary software packages
PyOWM
You can choose to make calls to the Open Weather Map REST APIs and process the JSON object that it returns to extract the fields of choice directly. Or alternately, you can use the PyOWM library - it is an elegant client Python wrapper for the OpenWeatherMap web APIs. You can very quickly make calls to the OWM APIs and consume the data easily using a more object-oriented approach. This is what I went with! Thanks to Claudio Sparpaglione for the PyOWM library!
To install PyOWM on your Raspberry Pi, do the following:
$ pip install pyowm
Read the PyOWM documentation to know more and to see their examples - https://pyowm.readthedocs.io/en/latest/index.html
ProtoStax Weather Station Demo Code
Grab the weather station demo code from the ProtoStax GitHub repository. You can clone it to your Raspberry Pi using the following command:
$ git clone https://github.com/protostax/ProtoStax_Weather_Station_Demo.git
You will need git on your Raspberry Pi of course! Use the following to install git if required:
$ sudo apt-get install git
You can also directly download it in zip format and unzip it.
[Note: The example also uses Waveshare's e-Paper python3 library. You can find the library on Github at https://github.com/waveshare/e-Paper, but it has the libraries and code for a multitude of displays. I've taken the two files that are needed for my e-Paper display and have incorporated them into my own code base, so you don't need to additionally get and install that library from GitHub. You can refer to the aboveGithub link, and if you are using a different sized display, you can always grab the requisite library files from the above repository! ]
Step 4 - Get Open Weather Map API Key
Sign up for account at Open Weather Map
Generate an API key. Note the API key generated - you will use it later in the Weather Station python program.
See steps below in the slideshow - the caption for each image is numbered and gives additional explanation for each step.
1 / 3 • 1. Sign up for an account at Open Weather Map

1. Sign up for an account at Open Weather Map
")
2. Go to API Keys. Generate a new key if necessary (pick a name for your key)

3. Note the key generated. You will be using this in the Weather Station python program
Step 5 - Demo Code
Let's take a look at the demo code and see what it is doing. To do that, we can split it up into two main parts.
- Open Weather Map
- ePaper display
You can quickly reference the demo code here:
https://github.com/protostax/ProtoStax_Weather_Station_Demo/blob/master/main.py
ePaper Display
You initialize your instance of the ePaper display using the following:
epd = epd2in7b.EPD()
init() and Clear() methods are used to initialize the object, and clear the contents of the display, respectively.
           epd.init()
           epd.Clear()
You can draw on the display using Python PIL's Image, ImageDraw and ImageFont. The epd library uses two images, one for black and one for red, to display black and red images on top of a white background. You first create two Images as shown:
           # Drawing on the Horizontal image
           HBlackimage = Image.new('1', (epd2in7b.EPD_HEIGHT, epd2in7b.EPD_WIDTH), 255)  # 298*126
           HRedimage = Image.new('1', (epd2in7b.EPD_HEIGHT, epd2in7b.EPD_WIDTH), 255)  # 298*126
After drawing on the individual black and white Images all the text and icons and stuff you want to display (we'll look at this later), you make the ePaper display it using
epd.display(epd.getbuffer(HBlackimage), epd.getbuffer(HRedimage))
The actual formatting of the Images will be discussed in the section below.
Open Weather Map - Getting and Displaying the Data
Firstly, you will need to replace the placeholder string below with your own OWM API Key that you generated in the previous step:
owm = pyowm.OWM('REPLACE_WITH_YOUR_OWM_API_KEY')
With the owm object thus initialized, you can invoke methods on it that will in turn call the APIs and return the results as objects.
You can invoke the weather APIs by either City Name, City ID, Lat/Lon or Zip Code. According to Open Weather Map,
"We recommend to call API by city ID to get unambiguous result for your city. "You can find your own city id by downloading, unzipping and checking the JSON file from the following:
http://bulk.openweathermap.org/sample/city.list.json.gz
Locate your city there and note the city ID. You can replace it in the code below. In the example, the city ID for Mountain View, CA is used.
# REPLACE WITH YOUR CITY ID
city_id = 5375480 # Mountain View, CA, USA
You can, of course, play around with other modes of invoking the APIs, like Lat/Lon, for example.
In the main function, we start with getting the current weather data for the city specified by the city_id.
def main():
   epd = epd2in7b.EPD()
   while True:
       # Get Weather data from OWM
       obs = owm.weather_at_id(city_id)
       location = obs.get_location().get_name()
       weather = obs.get_weather()
       reftime = weather.get_reference_time()
       description = weather.get_detailed_status()
       temperature = weather.get_temperature(unit='fahrenheit')
       humidity = weather.get_humidity()
       pressure = weather.get_pressure()
       clouds = weather.get_clouds()
       wind = weather.get_wind()
       rain = weather.get_rain()
       sunrise = weather.get_sunrise_time()
       sunset = weather.get_sunset_time()
       ...
It is fairly self-explanatory. We get the weather (obs.weather_at_id()) for the specified city_id. From that returned observation object, we can get the location information (e.g. Mountain View), as well as the weather object. The weather object has details like reference time when the observation was made, temperature, humidity, pressure, clouds, rain, sunrise time, sunset time, and so on.
Next, we would like to take that information and present it in a human-readable format. For example, temperature readings are good enough to round up to the nearest integer, as is the humidity. We would like to present the sunrise and sunset times in the local time, with AM/PM identifiers. We would also like to use icons and images to spruce up the interface and break the visual monotony.
An easy way to display icons and artwork on your ePaper display is to use a font like Meteocons, which maps font letters to specific icons, so by printing a character "B" you can print a Sunny icon!
Open Weather Map has weather codes for the current weather report, that correspond to different conditions like sunny, cloudy, etc. Check Weather Condition Codes under https://openweathermap.org/weather-conditions for the full list of weather codes.
I have created a weather_icon_dict dictionary that maps the weather codes from OWM to suitable icons from Meteocons. This enables us to easily use artwork and icons for display by simply using the character corresponding to that icon!
For example, I take the weather_code that I receive from OWM, and use the weather_icon_dict to get the mapping to the corresponding Meteocons icon, and then display that icon by just printing that character with the Meteocons font as shown below:
drawred.text((264 - w3 - 10, 0), weather_icon_dict[weather.get_weather_code()], font = fontweatherbig, fill = 0)
This will display icons for weather codes, like Sunny or Partly Cloudy etc. You can always modify the weather_icon_dict to the change the mapping to your taste!
Refer to http://www.alessioatzeni.com/meteocons/ for the mapping of meteocons to characters, and modify the dictionary below to change icons you want to use for different weather conditions!
Meteocons is free to use - you can customize the icons - do consider contributing back to Meteocons!
Because of the usage of Meteocons icons, every bit of information in the display below is just a text string, and the font size can be easily changed to play around with proportions. I played around with the information and the layout until I was satisfied with the look and feel, and showing the fields that were important to me.
This is what I finally settled on:
A closer look at the user interface of the ePaper display

A closer look at the user interface of the ePaper display
At the top is the location name, so you are reassured the weather data is for the right place. This is also useful if you end up displaying multiple locations (perhaps triggered by the switches that come with the ePaper display!)
location = obs.get_location().get_name()
Below that is the description of the weather, such as "few clouds" in the example above.
description = weather.get_detailed_status()
Following that is information about when the observation was made. This also helps to reassure the user that they are not looking at stale data.
reftime = weather.get_reference_time()
The next entry is displaying the Meteocons icon corresponding to the weather_code as I described above. I present all icons in red for visual relief:
drawred.text((264 - w3 - 10, 0), weather_icon_dict[weather.get_weather_code()], font = fontweatherbig, fill = 0)
The next entry is the current temperature, as well as the high and low for the day.
temperature = weather.get_temperature(unit='fahrenheit')
This returns a temperature object, which has several fields:
temperature: {'temp_kf': None, 'temp_max': 77.0, 'temp_min': 62.01, 'temp': 70.93}
I use the "temp", "temp_max" and "temp_min" fields in displaying current, max and min temperatures.
I then get the pressure information
pressure = weather.get_pressure()
which returns a pressure object
pressure: {'sea_level': None, 'press': 1011}
The next field is humidity
humidity = weather.get_humidity()
which returns the relative humidity in percent.
Pressure and humidity are shown as simple text strings in black using the ImageDraw library
           drawblack.text((10, 100), str("{} hPA".format(int(round(pressure['press'])))), font = font20, fill = 0)
           drawblack.text((150, 100), str("{}% RH".format(int(round(humidity)))), font = font20, fill = 0)
I also like to know the sunrise and sunset times.
       sunrise = weather.get_sunrise_time()
       sunset = weather.get_sunset_time()
These fields are unix timestamps and need to be converted to human readable format. I chose to display them in the local time zone, in AM/PM format.
I also used Meteocons to display icons representing sunrise and sunset, for some visual relief. These icons are displayed in red.
           drawred.text((20, 120), "A", font = fontweather, fill = 0)
           drawred.text((160, 120), "J", font = fontweather, fill = 0)
           drawblack.text((10, 150), time.strftime( '%I:%M %p', time.localtime(sunrise)), font = font20, fill = 0)
           drawblack.text((150, 150), time.strftime( '%I:%M %p', time.localtime(sunset)), font = font20, fill = 0)
Once the Image objects are rendered, we use epd.display as I describe above to display the contents of the two Image objects on the ePaper display. After displaying, we call epd.sleep() to put the ePaper display in low power mode/turned off.
           epd.display(epd.getbuffer(HBlackimage), epd.getbuffer(HRedimage))
           time.sleep(2)
           epd.sleep()
We then sleep for 10 minutes, before waking up and repeating the process in an endless while loop, until a Control C is pressed or the program is killed.
Step 5 - Test everything out
You can test the program out by running it with python (I used python3.5 - the epd library and my code assume python 3)
cd ProtoStax_Weather_Station_Demo
python3.5 main.py
The program connects to OWM, gets the weather data and displays it on the ePaper Screen. It then goes to sleep for 10 minutes, wakes up again and refreshes the data and the screen. You can of course modify the amount of time it sleeps.
Upon quitting the program, it cuts power to the ePaper Display. The ePaper display should not be powered on for extended periods of time. After rendering the image, it is advisable to make the device go into sleep mode (low power consumption), before waking it up and re-rendering. The latest version of the ePaper library also cuts power to the module when you invoke sleep. You can, of course, play around with this as well and change the behavior.
Another point to bear in mind is that the ePaper display, when not in use for extended periods, should ideally have its display cleared to white before storage. This will help prevent burn-in.
The demo code has a python script cleardisplay.py that you can use to clear the display before storing it.
python3.5 cleardisplay.py
Step 6 - Close It Up
Install the top bracing elements, side walls, and top. See steps below in the slideshow - the caption for each image is numbered and gives additional explanation for each step.
1 / 8 • 1. Screw in Top Bracing Elements into Bottom Bracing elements from previous step

1. Screw in Top Bracing Elements into Bottom Bracing elements from previous step

2. Add the side walls

3. Turning it around to show other side.

4. Add the Remaining 2 Side Walls.

5. Add Top Plate - Tabs of the Side Walls fit into the Wall Slots on Top Plate

6. Add Top Spacers between Top Bracing Element and Top Plate

7. Screw in the Top Plate - the enclosure is now finished!

8. View of finished enclosure from the other side
Here are all the steps in a single animated gif:
All the steps in a single animated gif. See details in the slideshow above

All the steps in a single animated gif. See details in the slideshow above
Step 7 - Display the Weather!
You can now always be able to see the current weather - keep it by your nightstand or coffee table and access the weather any time to plan your day! ?
A little homage to Make Magazine! Hope it comes back again like a Phoenix!

A little homage to Make Magazine! Hope it comes back again like a Phoenix!
Going Forward
Here are some ideas to take the project even further.
If you want to run your weather station headless and all the time without having to log in and launch the program, then you will want to make sure your program runs in the background. Otherwise, the moment you log out or exit your ssh session, the program will be terminated.
You can do that by specifying nohup when invoking the command:
nohup python3.5 main.py &
This will make the program run in the background, as well as not terminate when you exit your shell.
Even better, you can make sure that the program runs on boot-up, so any time you plug in your device, it will boot up and start the weather station program. There are many ways to do this. There are many pointers on the web, but feel free to ask questions in the comments below! ?
You can play around with the OWM APIs to get and display different types of weather data on your weather station other than the ones mentioned in this example. You can use different Meteocon icons to get more graphics on the display. You can even modify Meteocons to create your own icon (check their page link above - they give pointers as to how to do that), and give your contribution back to Meteocons!
You can use the switches on the ePaper display to toggle the display between different locations, or different views showing different data for the same location. The switches are connected to BCM pins 5, 6, 13 and 19. Check the Waveshare schematic here - https://www.waveshare.com/w/upload/2/2a/2.7inch_e-Paper_HAT_Schematic.pdf
You can laser cut holes for the switches and mounting holes for the ePaper display to the top of the enclosure, and mount the ePaper display on the top of the enclosure, and plug in the Raspberry Pi B+ below it. If you don't have access to a laser cutter, it is relatively easy to drill mounting (and switch access) holes into the acrylic plate using some painters tape (to protect the surface and keep everything clean and spiffy) and a drill to make the holes. If the holes are not small, it is recommended to use a step drill bit.
Can you think of any more? Write a comment below to let us know! ? Feel free to also ask any questions you may have! ?
Happy making! ?
Schematics, diagrams and documents
Code
Credits
Related products


Leave your feedback...