
Neonatal Incubator Monitoring Using Blues & Qubitro
Made by pradeeplogu0 / Environmental Sensing / Health / Sensors / Wearables
About the project
This project will detect any abnormality in the incubator’s conditions, such as low oxygen levels, high temperature, or irregular heartbeat.
Project info
Difficulty: Moderate
Platforms: DFRobot, Seeed Studio, Blues Wireless
Estimated time: 3 hours
License: GNU General Public License, version 3 or later (GPL3+)
Items used in this project
Hardware components

Story
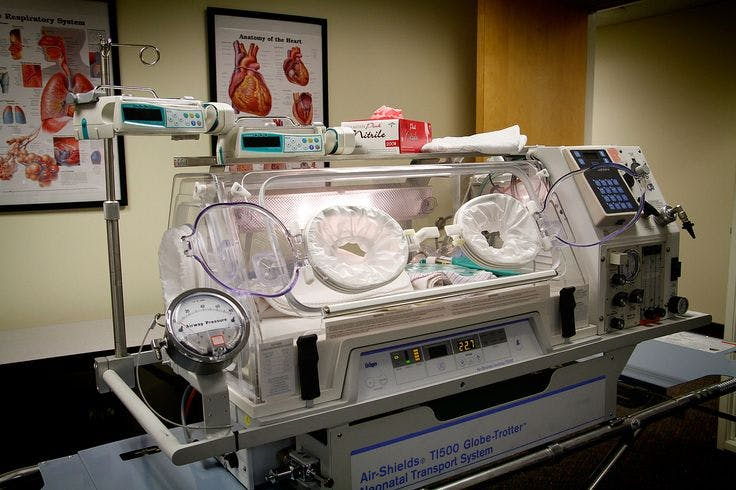
Neonatal incubators are devices that provide a controlled environment for premature or sick newborn babies. They help regulate the temperature, humidity, oxygen level, and other parameters inside the baby’s chamber. However, these devices require regular maintenance and monitoring to ensure their proper functioning and safety. Moreover, they can be costly and inaccessible for many developing countries and conflict zones.
According to a report by the National Crime Records Bureau (NCRB), there were 1, 153 cases of accidental deaths due to fire in hospitals and nursing homes in India in 2021. Out of these, 47 cases involved neonatal incubators, resulting in 52 deaths and 63 injuries. The report also stated that most of these accidents were caused by short circuits, faulty wiring, or improper maintenance of the incubators.
These incidents highlight the need for better safety measures and quality standards for neonatal incubators in India. Some of the possible solutions are:
- Regular inspection and maintenance of the incubators and their electrical connections by qualified technicians.
- Installation of fire alarms, smoke detectors, sprinklers, and extinguishers in the NICU and other hospital premises.
- Provide adequate training and awareness for the medical staff and the parents on how to handle and operate the incubators safely and efficiently.
- Adoption of innovative technologies such as IoT-based incubator monitoring systems that can remotely monitor and control the incubator parameters and alert the authorities in case of any abnormality or emergency.
Neonatal incubators are vital for saving the lives of vulnerable infants. However, they can also pose a serious threat to neonatal care if they are not properly maintained and monitored. Therefore, it is imperative to prevent and reduce the incidence of incubator accidents in India and ensure a safe and healthy environment for the babies and their caregivers.
To address these challenges, I have proposed and developed IoT-based incubator monitoring systems that use sensors, microcontrollers, and internet applications to monitor and control the incubator parameters remotely. These systems aim to improve the quality of neonatal care, reduce the workload of medical staff, and save the lives of vulnerable infants.
The proposed system is an IoT-based incubator monitoring system that can measure various parameters of the babies and the incubator environment using sensors, a microcontroller, a cellular module, and a cloud server. The system can provide real-time and continuous monitoring of the babies’ health and well-being, as well as alert the doctors and parents if any abnormality is detected. The system can also improve the quality of neonatal care and reduce the workload of medical staff.
The main core of this project is a 60GHz mmWave sensor that can detect accurate breath, heartbeat, and sleep status of the babies. The 60GHz mmWave sensor is a radar-based sensor that can measure the chest movement and heart rate of babies without any contact or attachment. The sensor can also detect the sleep state of the babies by analyzing their breathing patterns and body movements. The sensor can provide real-time and continuous monitoring of the babies’ health and well-being.
The other sensors can measure the temperature, humidity, pressure, eCO2/CO2, TVOC, and AQI of the incubator and send the data to the microcontroller. The temperature sensor can measure the ambient temperature inside the incubator and ensure it is within the optimal range for the babies’ comfort and development. The humidity sensor can measure the relative humidity inside the incubator and prevent dehydration or infection of the baby's skin. The pressure sensor can measure the air pressure inside the incubator and prevent hypoxia or hyperoxia of the babies’ lungs. The eCO2/CO2 sensor can measure the carbon dioxide level inside the incubator and prevent hypercapnia or hypocapnia of the babies’ blood. The TVOC sensor can measure the total volatile organic compounds level inside the incubator and prevent exposure to harmful chemicals or odors. The AQI sensor can measure the air quality index inside the incubator and prevent exposure to dust, smoke, or allergens.
The microcontroller will collect all the sensor details and it will transfer them to the cloud via Blues Notecard which is a cellular module that can process the data from the sensors and send it to the cloud server via the cellular network/Wi-Fi. The cellular module can also receive commands from the cloud server to control the incubator parameters such as temperature, humidity, oxygen level, etc.
The cloud server is a Blues Notehub that can store the data and provide a web interface for doctors and parents to access it remotely. The cloud server can also send notifications to doctors and parents via email or SMS if any parameter exceeds a predefined threshold or if any emergency occurs. The cloud server can also display images of the babies captured by a camera attached to the incubator for visual inspection.
The proposed system is a smart solution for neonatal care that can improve the quality of life for premature or sick newborn babies. It can also reduce the cost and complexity of neonatal incubators by using IoT technology. It can also provide remote access and control for doctors and parents to monitor and interact with their babies.
Hardware Requirements ⚙️:
- LTE-M Notecard Global
- Notecarrier A with LiPo, Solar, and Qwiic Connectors
- Xiao nRF52840
- MR60BHA1 60GHz mmWave Module
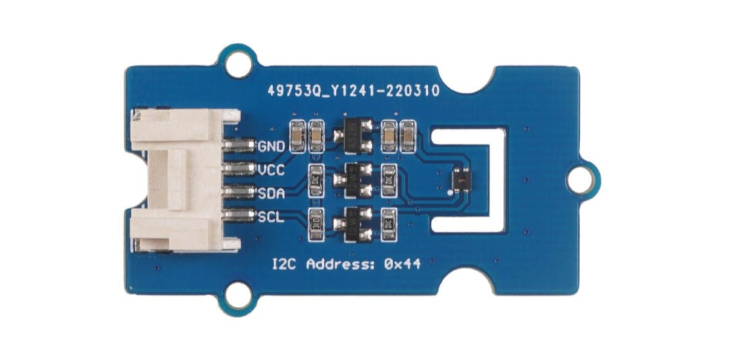
- Grove SHT40 Digital Sensor
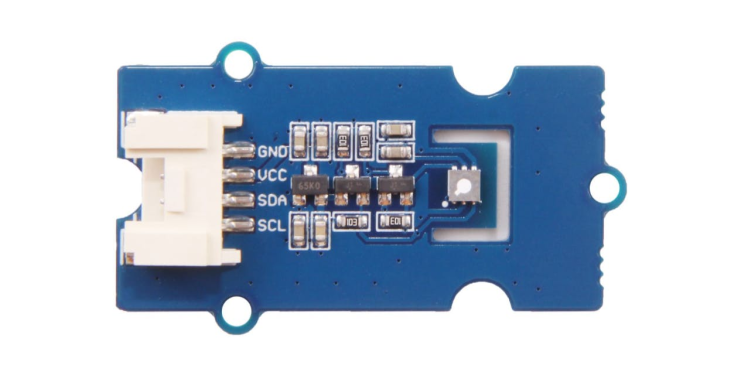
- Grove-VOC and eCO2 Gas Sensor (SGP30)
- Bosch BMP280 Pressure Sensor
Software Requirements ?️:
Flow Diagram ?:
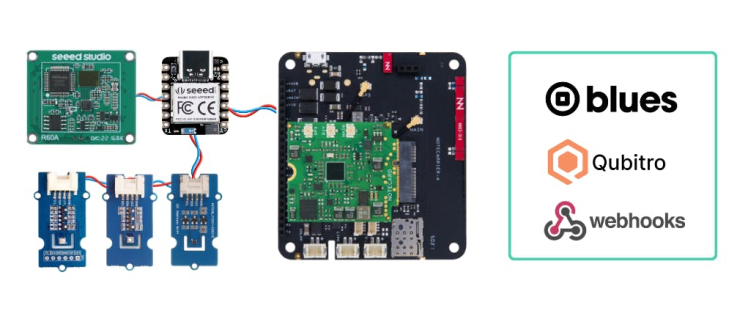
In this project, I have designed and built a smart incubator system to monitor and control various environmental parameters for optimal incubation. The system uses a Xiao nRF52840 Sense board as the main controller that collects data from different sensors, such as temperature, humidity, pressure, eCO2 level, VOC level, heartbeat, and breath rate. The data is then transmitted to the Blues Notehub cloud service via the Blues Notecard module. On the cloud, I can use the Qubitro IoT platform to visualize and analyze the incubator data in real-time. Moreover, I can set up a rule with Qubitro functions to send me an alert message if there are any anomalies or deviations in the sensor readings. This way, we can ensure the health and safety of the incubator babies.
Step 1️⃣- 60GHz mmWave Sensor Setup:
The 60GHz mmWave Sensor - Human Static Sleep Breathing Monitoring (MR60BHA1) is a radar module that can sense human presence, motion, respiration, heart rate, and sleep status. It operates on the FMCW (frequency-modulated continuous wave) radar system and has a 1 transmit 3 receive (1T3R) antenna. It can capture the motion tomography of the human body and measure the vital signs with high precision and security. It is suitable for various applications in smart homes, health care, and medical fields. Some of the advantages and features of this sensor are:
- It can achieve heart rate accuracy ≥95% and respiratory rate accuracy ≥90%.
- It can operate in a range of 0.4 to 2 meters and refresh the data every 1 to 30 seconds
- It can output the human presence status using two pins: GP2 for occupied and GP3 for unoccupied.
- It can report the sleep status combined with long-term sleep posture and body movement collection.
- It can support secondary development and adapt to various scenarios and applications.
- It can work independently from temperature, humidity, noise, airflow, dust, light, and other environmental influences.
- It can provide more secure identification than vision-based devices, without concern about privacy leakage.
you can visit the following links to get know more about the sensor:
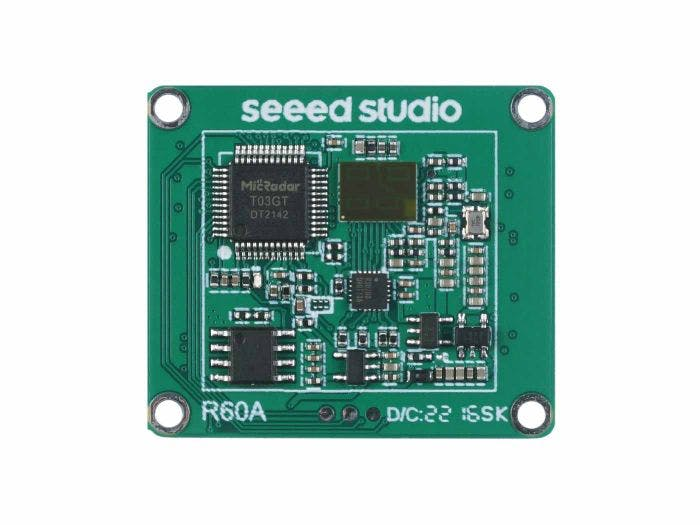
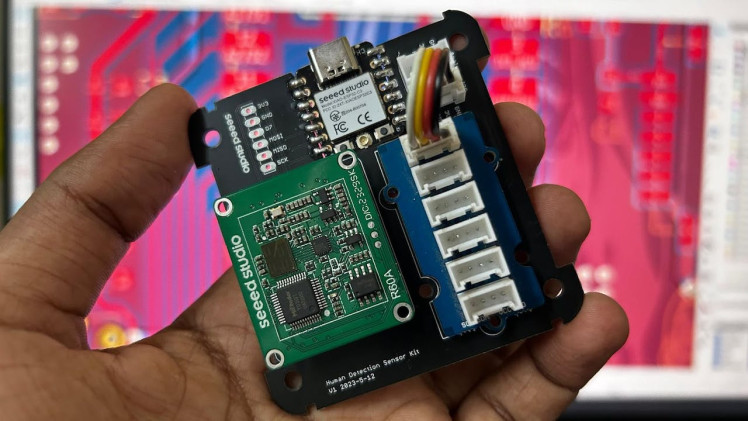
To communicate with the sensor, we can use UART communication with our controller. To make a flexible connection we can use Seeed Studio’s Fusion PCB and PCBA service to build our own PCB board, this has a connector unit for the mmWave sensor also it has a separate I2C port to add an external sensor.
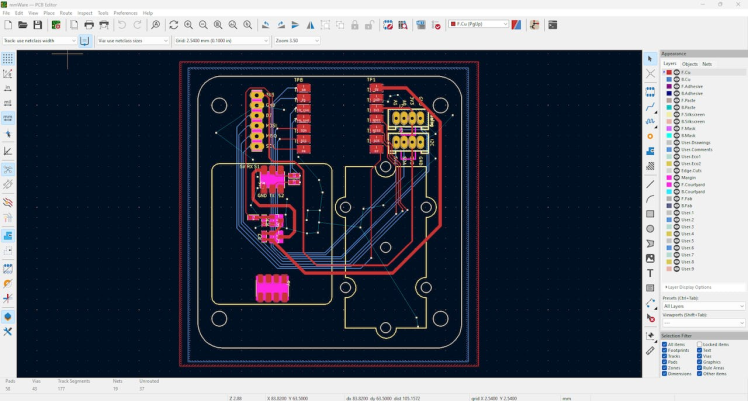
Here is the layout diagram of the PCB.
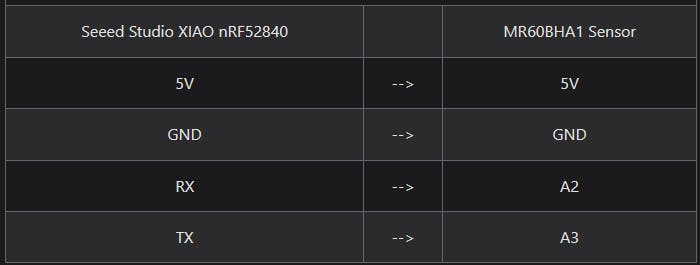
We can connect the mmWave sensor with Xiao using the software serial of pins A2 and A3.
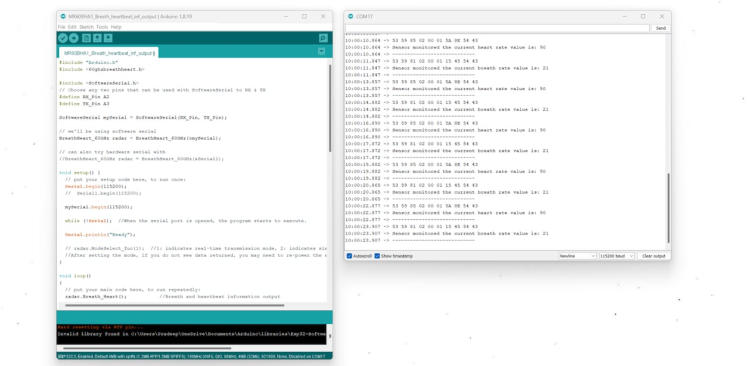
Here is an example Arduino sketch that can measure heart rate and breath rate.
#include "Arduino.h"
#include <60ghzbreathheart.h>
#include <SoftwareSerial.h>
// Choose any two pins that can be used with SoftwareSerial to RX & TX
#define RX_Pin A2
#define TX_Pin A3
SoftwareSerial mySerial = SoftwareSerial(RX_Pin, TX_Pin);
// we'll be using software serial
BreathHeart_60GHz radar = BreathHeart_60GHz(&mySerial);
void setup() {
  // put your setup code here, to run once:
  Serial.begin(115200);
  mySerial.begin(115200);
  while (!Serial);  //When the serial port is opened, the program starts to execute.
  Serial.println("Ready");
}
void loop()
{
  radar.Breath_Heart();           //Breath and heartbeat information output
  if (radar.sensor_report != 0x00) {
    switch (radar.sensor_report) {
      case HEARTRATEVAL:
        Serial.print("Sensor monitored the current heart rate value is: ");
        Serial.println(radar.heart_rate, DEC);
        Serial.println("----------------------------");
        break;
      case HEARTRATEWAVE:  //Valid only when real-time data transfer mode is on
        Serial.print("The heart rate waveform(Sine wave) -- point 1: ");
        Serial.print(radar.heart_point_1);
        Serial.print(", point 2 : ");
        Serial.print(radar.heart_point_2);
        Serial.print(", point 3 : ");
        Serial.print(radar.heart_point_3);
        Serial.print(", point 4 : ");
        Serial.print(radar.heart_point_4);
        Serial.print(", point 5 : ");
        Serial.println(radar.heart_point_5);
        Serial.println("----------------------------");
        break;
      case BREATHNOR:
        Serial.println("Sensor detects current breath rate is normal.");
        Serial.println("----------------------------");
        break;
      case BREATHRAPID:
        Serial.println("Sensor detects current breath rate is too fast.");
        Serial.println("----------------------------");
        break;
      case BREATHSLOW:
        Serial.println("Sensor detects current breath rate is too slow.");
        Serial.println("----------------------------");
        break;
      case BREATHNONE:
        Serial.println("There is no breathing information yet, please wait...");
        Serial.println("----------------------------");
        break;
      case BREATHVAL:
        Serial.print("Sensor monitored the current breath rate value is: ");
        Serial.println(radar.breath_rate, DEC);
        Serial.println("----------------------------");
        break;
      case BREATHWAVE:  //Valid only when real-time data transfer mode is on
        Serial.print("The breath rate waveform(Sine wave) -- point 1: ");
        Serial.print(radar.breath_point_1);
        Serial.print(", point 2 : ");
        Serial.print(radar.breath_point_2);
        Serial.print(", point 3 : ");
        Serial.print(radar.breath_point_3);
        Serial.print(", point 4 : ");
        Serial.print(radar.breath_point_4);
        Serial.print(", point 5 : ");
        Serial.println(radar.breath_point_5);
        Serial.println("----------------------------");
        break;
    }
  }
  delay(200);
}
Here are the serial monitor results.
Instead of using wires, you can create your customized PCBs with Seeed Fusion PCBA services, and they're also offering free prototype and functional testing on your first sample.

Discover more here! Invigorate your Inspiration for IoT with Wio-E5 and FREE Seeed Fusion PCBA Prototypes https://seeedstudio.com/blog/2021/10/21/invigorate-your-inspiration-for-iot-with-lora-e5-and-free-seeed-fusion-pcba-prototypes/…

Unleash the Magic Power of IoT with the New Wio-WM1110 and Get FREE Seeed Fusion PCBA Services https://seeedstudio.com/blog/2023/06/0
Here you can find out more info on the Wio E5 and Wio WM1110.
Step 2️⃣- Environmental Sensors Setup:
To monitor the incubator's environmental conditions, we are going to use 3 different sensors. The first one is the Grove SHT40 Digital Sensor, The Grove SHT40 Digital Sensor is a device that can measure temperature and humidity with high accuracy and low power consumption. It is compatible with the Grove platform, which makes it easy to connect and use with various microcontrollers and microprocessors.
The second one is the Grove-VOC and eCO2 Gas Sensor (SGP30), The Grove-VOC and eCO2 Gas Sensor (SGP30) is a device that can measure the concentration of volatile organic compounds (VOCs) and equivalent carbon dioxide (eCO2) in the air. It is based on the SGP30 sensor, which is a digital multi-pixel gas sensor that uses Sensirion’s CMOSens technology. This technology enables a complete sensor system on a single chip, with a digital I2C interface, a temperature-controlled micro hotplate, and two preprocessed indoor air quality signals. The SGP30 sensor can provide more detailed information about the air quality than traditional metal-oxide gas sensors, which only have one sensing element. The Grove-VOC and eCO2 Gas Sensor (SGP30) are compatible with the Grove platform.
And the final one is Bosch BMP280 Pressure Sensor. The Bosch BMP280 Pressure Sensor is a device that can measure the absolute barometric pressure in the air.
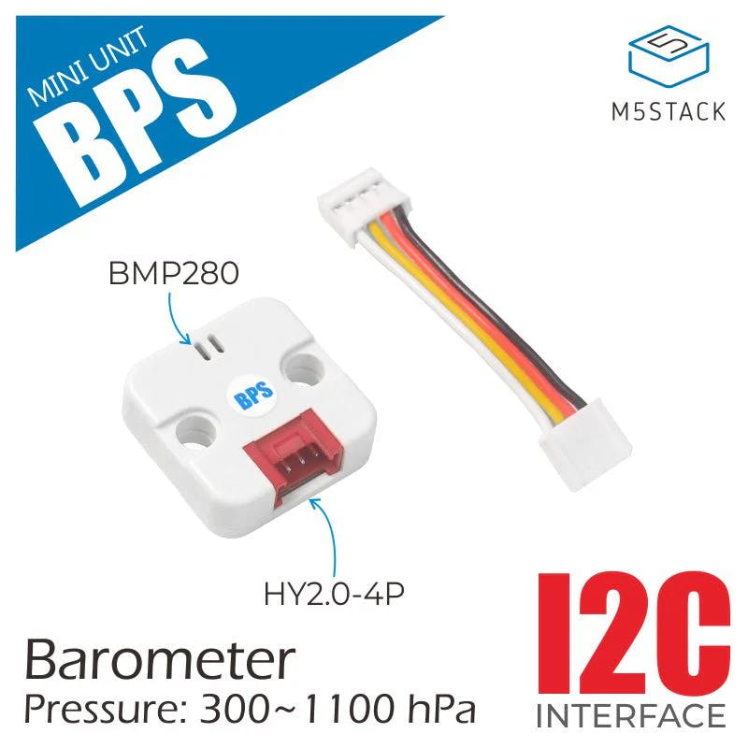
It is designed for mobile applications, such as smartphones, GPS modules, or watches. Here are some key points about this sensor:
- Technology: The sensor is based on Bosch’s proven piezo-resistive pressure sensor technology, which features high accuracy and linearity, as well as long-term stability and high EMC robustness.
- Performance: The sensor can measure the pressure from 300 to 1100 hPa, and the temperature from -40 to 85°C. It has a resolution of 0.01 hPa and 0.01°C and an absolute accuracy of about ±1 hPa. It also has a low power consumption of 3.4 μA at a 1 Hz data rate.
- Interface: The sensor supports both I2C and SPI interfaces, which allow for easy integration with various microcontrollers and microprocessors. The sensor also provides numerous device operation options, such as oversampling, filter settings, and power modes.
- Applications: The sensor can be used for various applications that require accurate barometric pressure measurements, such as indoor and outdoor navigation, weather forecasts, altitude tracking, and health monitoring.
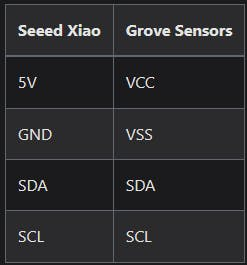
The common thing between these sensors is they all work with I2C communication. We also have added the I2C port to our PCB. So, we can directly connect the sensors.
Here is an example Arduino sketch that can measure and print all these sensor values via the serial monitor.
#include <Arduino.h>
#include <SensirionI2CSht4x.h>
#include <Wire.h>
#include "sensirion_common.h"
#include "sgp30.h"
SensirionI2CSht4x sht4x;
#include <Adafruit_BMP280.h>
Adafruit_BMP280 bme;
#define usbSerial Serial
void setup()
{
#ifdef usbSerial
usbSerial.begin(115200);
#endif
Wire.begin();
bme.begin(0x76);
s16 err;
u16 scaled_ethanol_signal, scaled_h2_signal;
Serial.println("serial start!!");
while (sgp_probe() != STATUS_OK) {
usbSerial.println("SGP failed");
while (1);
}
/*Read H2 and Ethanol signal in the way of blocking*/
err = sgp_measure_signals_blocking_read(&scaled_ethanol_signal,
&scaled_h2_signal);
if (err == STATUS_OK) {
usbSerial.println("get ram signal!");
} else {
usbSerial.println("error reading signals");
}
err = sgp_iaq_init();
uint16_t error;
char errorMessage[256];
sht4x.begin(Wire);
uint32_t serialNumber;
error = sht4x.serialNumber(serialNumber);
if (error) {
usbSerial.print("Error trying to execute serialNumber(): ");
errorToString(error, errorMessage, 256);
usbSerial.println(errorMessage);
} else {
usbSerial.print("Serial Number: ");
usbSerial.println(serialNumber);
}
static unsigned number = 0;
}
void loop()
{
number = number + 1;
usbSerial.println("*********************************************************");
usbSerial.println("***************** Environmental Condition ***************");
usbSerial.println("*********************************************************");
uint16_t error;
char errorMessage[256];
float pressure, Temp;
float temperature;
float humidity;
error = sht4x.measureHighPrecision(temperature, humidity);
if (error) {
usbSerial.print("Error trying to execute measureHighPrecision(): ");
errorToString(error, errorMessage, 256);
usbSerial.println(errorMessage);
} else {
usbSerial.print("Temperature:");
usbSerial.print(temperature);
usbSerial.println(" C");
usbSerial.print("Humidity:");
usbSerial.print(humidity);
usbSerial.println(" %");
}
s16 err = 0;
u16 tvoc_ppb, co2_eq_ppm;
err = sgp_measure_iaq_blocking_read(&tvoc_ppb, &co2_eq_ppm);
if (err == STATUS_OK) {
usbSerial.print("tVOC Concentration:");
usbSerial.print(tvoc_ppb);
usbSerial.println(" ppb");
usbSerial.print("CO2eq Concentration:");
usbSerial.print(co2_eq_ppm);
usbSerial.println(" ppm");
} else {
usbSerial.println("error reading IAQ valuesn");
}
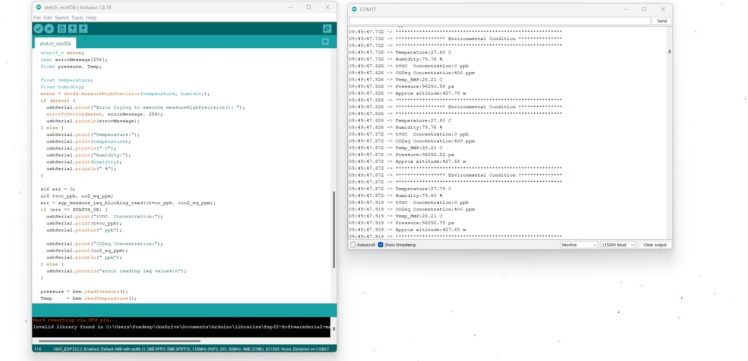
pressure = bme.readPressure();
Temp = bme.readTemperature();
usbSerial.print("Temp_BMP:");
usbSerial.print(Temp);
usbSerial.println(" C");
usbSerial.print("Pressure:");
usbSerial.print(pressure);
usbSerial.println(" pa");
usbSerial.print("Approx altitude:");
usbSerial.print(bme.readAltitude(1013.25)); /* Adjusted to local forecast! */
usbSerial.println(" m");
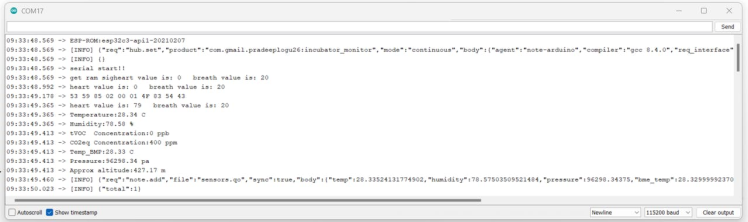
}Here is the serial monitor results,
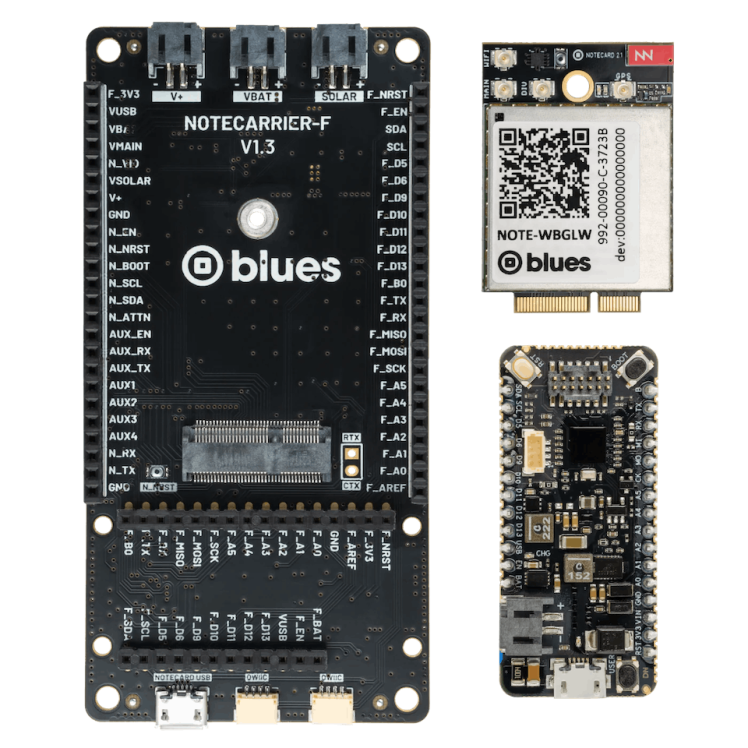
Step 3️⃣- Blues Notecard/Carrier Setup:
Blues Notecard and Notecarrier are products that enable developers to build connected solutions with ease and simplicity. The Notecard is a small module that provides a secure and reliable connection to the cloud via cellular or Wi-Fi networks. The Notecarrier Is a board that hosts the Notecard and provides various features such as power options, antenna connectors, and peripheral ports. Together, they form a powerful platform for IoT applications that can be prototyped and deployed quickly.
Some of the benefits of using Blues Notecard and Notecarrier are:
- They reduce the complexity of building connected solutions by handling the communication and security aspects for you.
- They are compatible with any microcontroller or single-board computer, such as Arduino, Raspberry Pi, or Feather.
- They offer flexible power options, such as AA batteries, LiPo, solar, and micro-USB.
- They support a variety of sensors and peripherals through Qwiic and Grove ports.
- They use JSON objects called Notes to send and receive data to and from the cloud.
- They work with Notehub, a cloud service that provides fleet management and data routing capabilities.
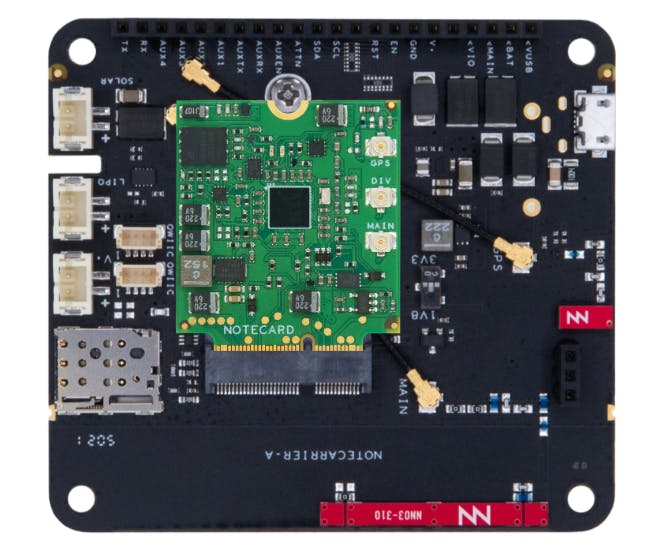
As with all the above environmental sensors, we can connect to the Blues Notecard directly via I2C. Here is a simple sketch that can send random values to the Blues Notehub via Xiao using the I2C protocol.
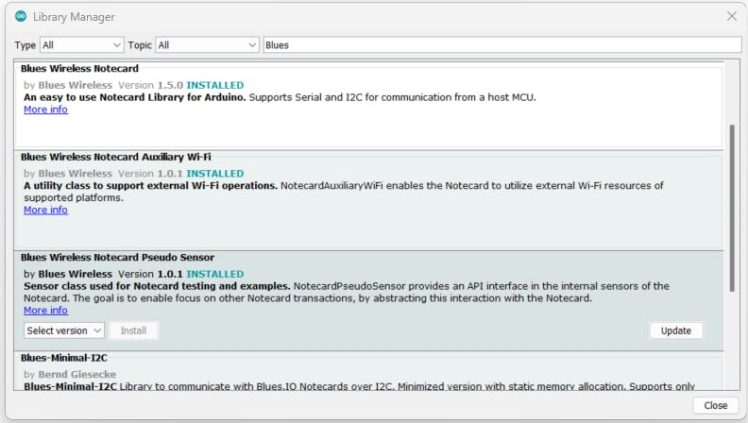
Note: Make sure that you have already installed the Blues Arduino Client library.
// Copyright 2019 Blues Inc. All rights reserved.
//
// Use of this source code is governed by licenses granted by the
// copyright holder including that found in the LICENSE file.
//
// This example contains the complete source for the Sensor Tutorial at
// https//blues.dev
// https://blues.dev/guides-and-tutorials/collecting-sensor-data/notecarrier-f/blues-wireless-swan/c-cpp-arduino-wiring/
// Include the Arduino library for the Notecard
#include <Notecard.h>
#include <NotecardPseudoSensor.h>
// #define txRxPinsSerial Serial1
#define usbSerial Serial
// This is the unique Product Identifier for your device
#ifndef PRODUCT_UID
#define PRODUCT_UID "" // "com.my-company.my-name:my-project"
#pragma message "PRODUCT_UID is not defined in this example. Please ensure your Notecard has a product identifier set before running this example or define it in code here. More details at https://dev.blues.io/tools-and-sdks/samples/product-uid"
#endif
#define myProductID PRODUCT_UID
using namespace blues;
Notecard notecard;
NotecardPseudoSensor sensor(notecard);
void setup()
{
// Set up for debug output (if available).
#ifdef usbSerial
// If you open Arduino's serial terminal window, you'll be able to watch
// JSON objects being transferred to and from the Notecard for each request.
usbSerial.begin(115200);
const size_t usb_timeout_ms = 3000;
for (const size_t start_ms = millis(); !usbSerial && (millis() - start_ms) < usb_timeout_ms;)
;
notecard.setDebugOutputStream(usbSerial);
#endif
// Initialize the physical I/O channel to the Notecard
#ifdef txRxPinsSerial
notecard.begin(txRxPinsSerial, 9600);
#else
notecard.begin();
#endif
J *req = notecard.newRequest("hub.set");
if (myProductID[0])
{
JAddStringToObject(req, "product", myProductID);
}
JAddStringToObject(req, "mode", "continuous");
notecard.sendRequestWithRetry(req, 5); // 5 seconds
}
// In the Arduino main loop which is called repeatedly, add outbound data every
void loop()
{
// Count the simulated measurements that we send to the cloud, and stop the
// demo before long.
static unsigned eventCounter = 0;
if (++eventCounter > 25)
{
notecard.logDebug("Demo cycle complete. Program stopped. Press RESET to restart.n");
delay(10000); // 10 seconds
return;
}
float temperature = random(30, 100);
float humidity = random(50, 100);
usbSerial.print("Temperature = ");
usbSerial.print(temperature);
usbSerial.println(" *C");
usbSerial.print("Humidity = ");
usbSerial.print(humidity);
usbSerial.println(" %");
J *req = notecard.newRequest("note.add");
if (req != NULL)
{
JAddStringToObject(req, "file", "sensors.qo");
JAddBoolToObject(req, "sync", true);
J *body = JAddObjectToObject(req, "body");
if (body)
{
JAddNumberToObject(body, "temp", temperature);
JAddNumberToObject(body, "humidity", humidity);
}
notecard.sendRequest(req);
}
delay(15000);
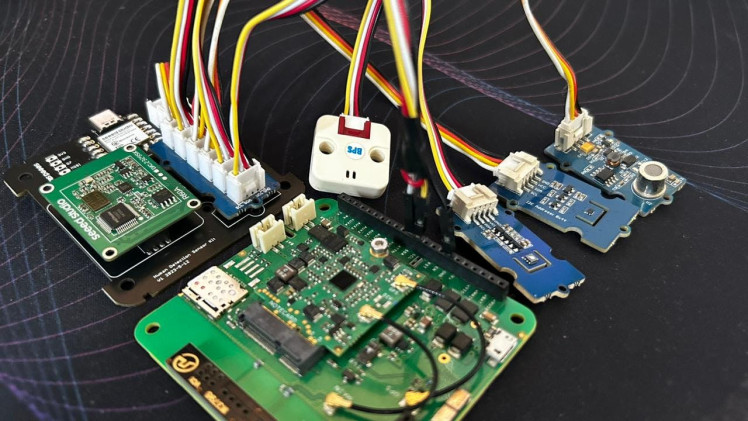
}Step 4️⃣- Final Hardware Setup:
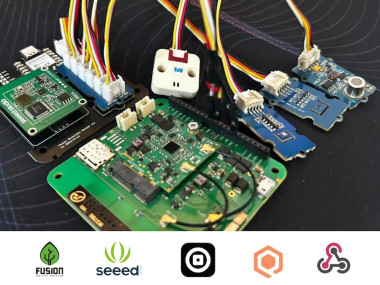
Here is the final hardware setup which includes all the environmental sensors and Blues Notecard.
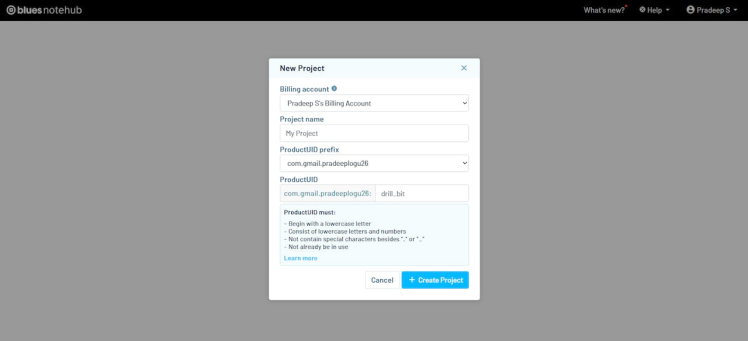
Note: Before going to upload the sketch, we need to create a new project with Blues Notehub.
Navigate to the Blues Notehuband create a new project. Then copy the product UID, which we will use in the below sketch,
Upload this sketch below to send your incubator data to Blues Notehub.
// Copyright 2019 Blues Inc.  All rights reserved.
//
// Use of this source code is governed by licenses granted by the
// copyright holder including that found in the LICENSE file.
//
// This example contains the complete source for the Sensor Tutorial at
// https//blues.dev
// https://blues.dev/guides-and-tutorials/collecting-sensor-data/notecarrier-f/blues-wireless-swan/c-cpp-arduino-wiring/

// Include the Arduino library for the Notecard
#include <Notecard.h>
#include <NotecardPseudoSensor.h>

// #define txRxPinsSerial Serial1
#define usbSerial Serial

// This is the unique Product Identifier for your device
#ifndef PRODUCT_UID
#define PRODUCT_UID "" // "com.my-company.my-name:my-project"
#pragma message "PRODUCT_UID is not defined in this example. Please ensure your Notecard has a product identifier set before running this example or define it in code here. More details at https://dev.blues.io/tools-and-sdks/samples/product-uid"
#endif

#define myProductID PRODUCT_UID

using namespace blues;

Notecard notecard;
NotecardPseudoSensor sensor(notecard);

void setup()
{
  // Set up for debug output (if available).
#ifdef usbSerial
  // If you open Arduino's serial terminal window, you'll be able to watch
  // JSON objects being transferred to and from the Notecard for each request.
  usbSerial.begin(115200);
  const size_t usb_timeout_ms = 3000;
  for (const size_t start_ms = millis(); !usbSerial && (millis() - start_ms) < usb_timeout_ms;)
    ;
  notecard.setDebugOutputStream(usbSerial);
#endif

  // Initialize the physical I/O channel to the Notecard
#ifdef txRxPinsSerial
  notecard.begin(txRxPinsSerial, 9600);
#else
  notecard.begin();
#endif

  J *req = notecard.newRequest("hub.set");
  if (myProductID[0])
  {
    JAddStringToObject(req, "product", myProductID);
  }
  JAddStringToObject(req, "mode", "continuous");
  notecard.sendRequestWithRetry(req, 5); // 5 seconds
}

// In the Arduino main loop which is called repeatedly, add outbound data every
void loop()
{
  // Count the simulated measurements that we send to the cloud, and stop the
  // demo before long.
  static unsigned eventCounter = 0;
  if (++eventCounter > 25)
  {
    notecard.logDebug("Demo cycle complete. Program stopped. Press RESET to restart.n");
    delay(10000); // 10 seconds
    return;
  }

  float temperature = random(30, 100);
  float humidity = random(50, 100);
  usbSerial.print("Temperature = ");
  usbSerial.print(temperature);
  usbSerial.println(" *C");
  usbSerial.print("Humidity = ");
  usbSerial.print(humidity);
  usbSerial.println(" %");

  J *req = notecard.newRequest("note.add");
  if (req != NULL)
  {
    JAddStringToObject(req, "file", "sensors.qo");
    JAddBoolToObject(req, "sync", true);
    J *body = JAddObjectToObject(req, "body");
    if (body)
    {
      JAddNumberToObject(body, "temp", temperature);
      JAddNumberToObject(body, "humidity", humidity);
    }
    notecard.sendRequest(req);
  }
  delay(15000);
}
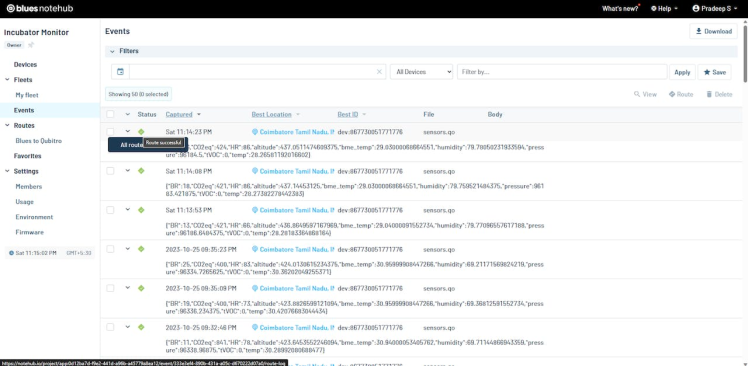
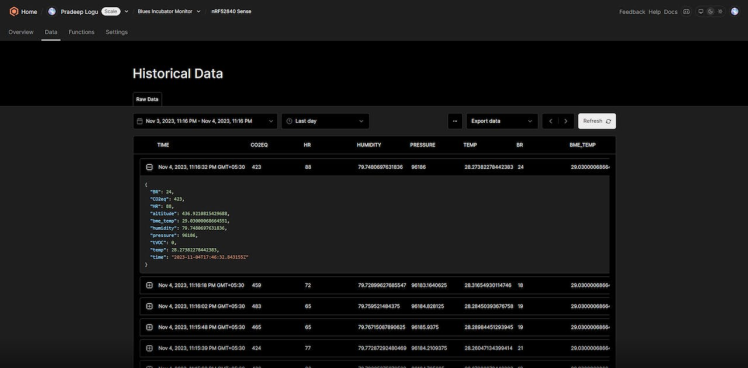
Next, open the Blues Notehubproject page. You can see all our data on Notehub.
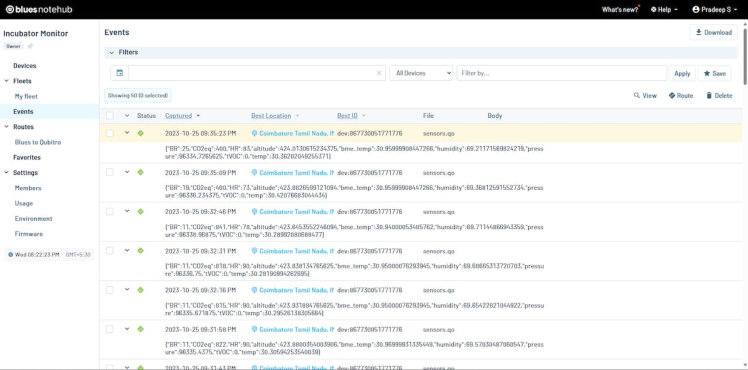
Step 5️⃣- Notehub Data Routing:
We will use Qubitro, a cloud platform for IoT analytics and automation, to create a dashboard and an alert system based on the data that Notehub sends from our Notecard devices.
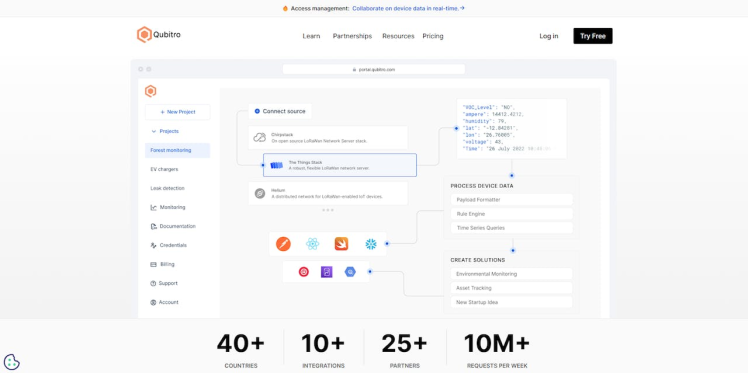
Qubitrois a device data platform that helps you collect, process, and activate data from your connected devices. It is a web-based tool that lets you integrate with various IoT platforms, such as Arduino, Raspberry Pi, and LoRaWAN, and create dashboards and applications with no-code or low-code solutions. You can use Qubitro to monitor and control your devices, analyze and visualize your data, and automate your workflows. Qubitro is designed for enterprises, integrators, and startups who want to build modern and scalable IoT solutions with ease and simplicity
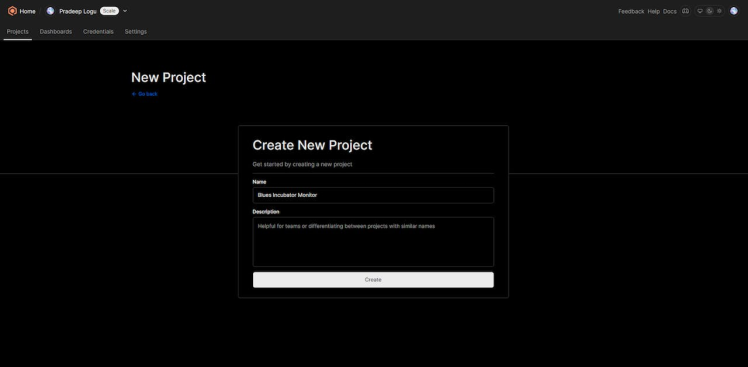
Navigate to the Qubitro Portal and create a new project.
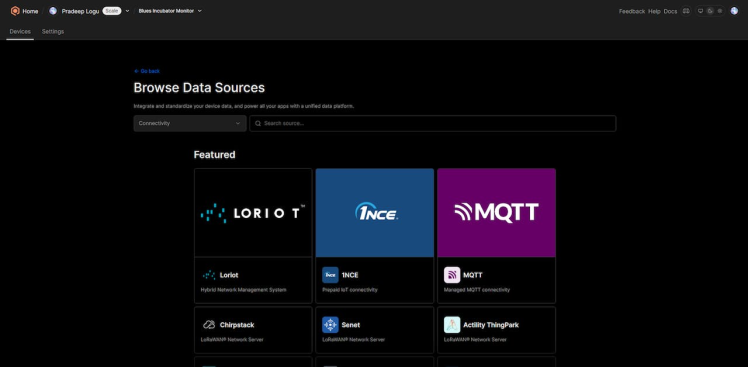
Then, select MQTT as the data source.
Next, enter all the input details as needed.
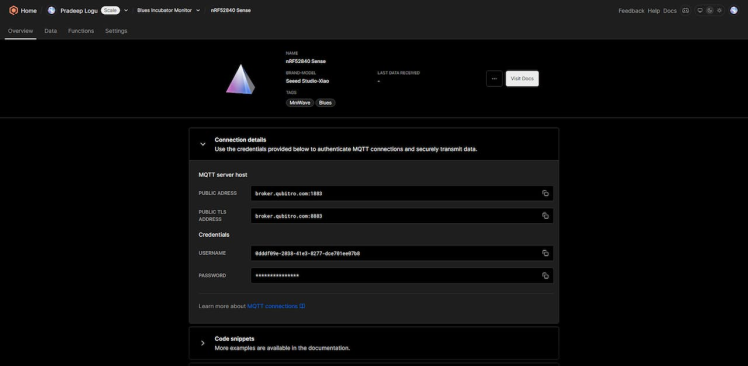
Then, open the created MQTT source and select the connection details. It will show you all the credentials. We need these credentials to transfer our data to Qubitro.
Let’s move on to the Blues Notehub’s route page. Here, we must create a new MQTT route and change the username and password according to your Qubitrocredentials.
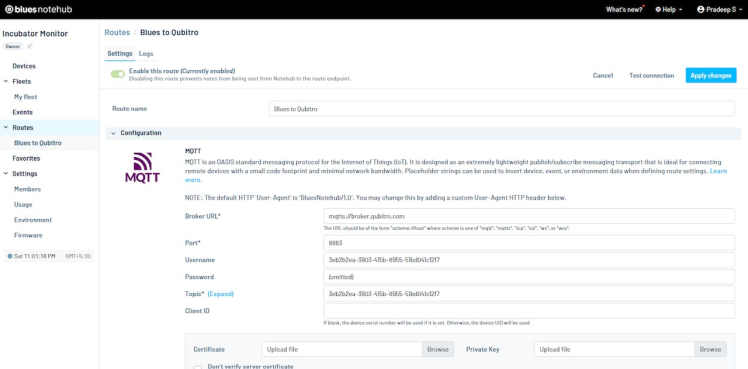
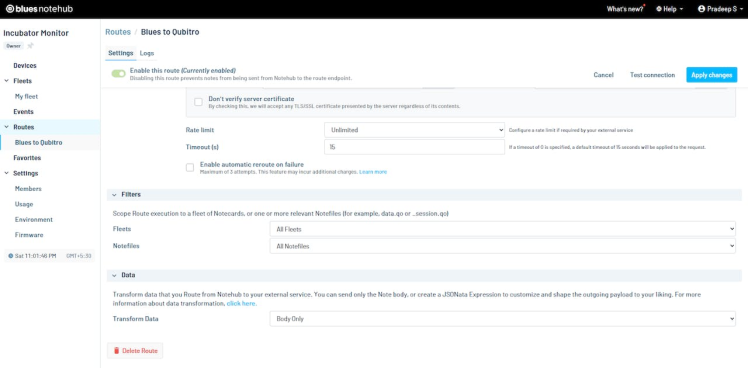
At the bottom, define which data should move to Qubitro.
After the payload successfully transfers to Qubitro, you can see the green tick that shows all routes are successfully connected message.
Then open the Qubitroportal to monitor the incoming data.
Step 6️⃣- Qubitro Data Visualization:
To set up a dashboard, go to the Qubitroportal and select the device that you want to display data from. Then, click on the Data tab and you will see a table with the device’s data, such as topic, payload, timestamp, etc.
To create a new dashboard, follow these steps:
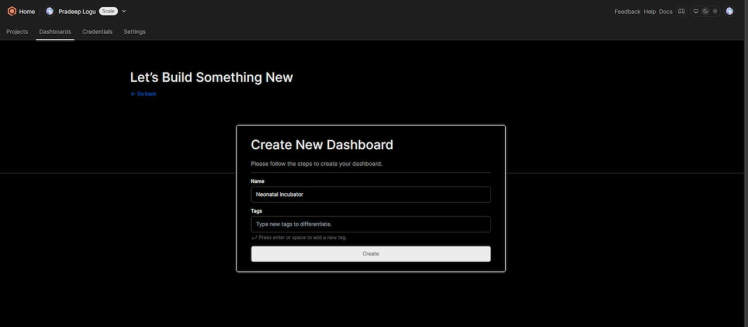
- Navigate to the Dashboards section and select the Create Dashboard option.
- Enter a name and a description for your dashboard. For instance, you can name it “Neonatal Incubators” and provide a relevant description.
- Click on the Create button to finish the process.
The dashboard editor lets you add widgets to show your data. Widgets are graphics for different data types, like charts, gauges, tables, etc.
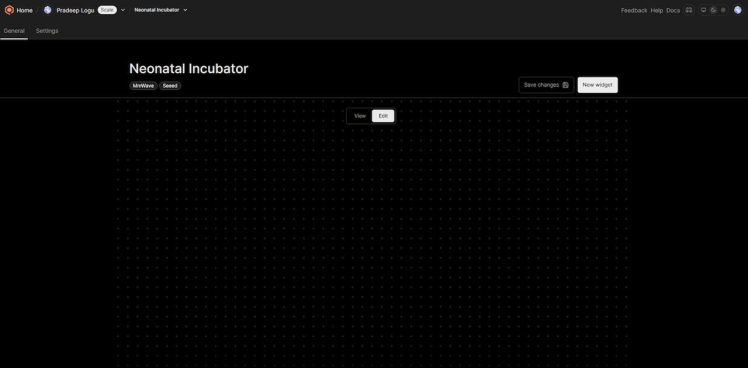
To add a widget, click on the Add Widget button and select the type of widget that you want to use.
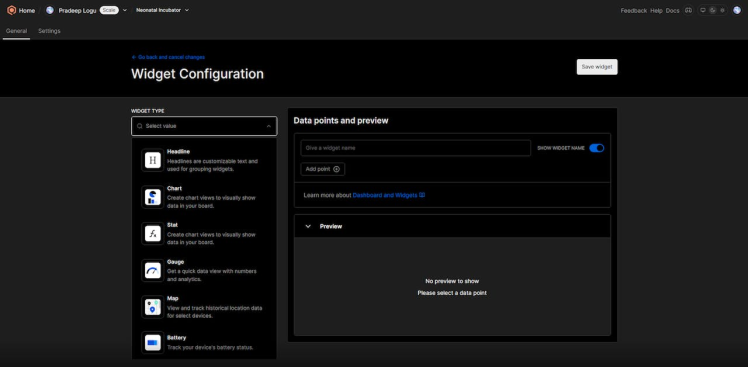
For this example, we will use a gauge to show the heart rate readings. Then select the project and particular device data field.
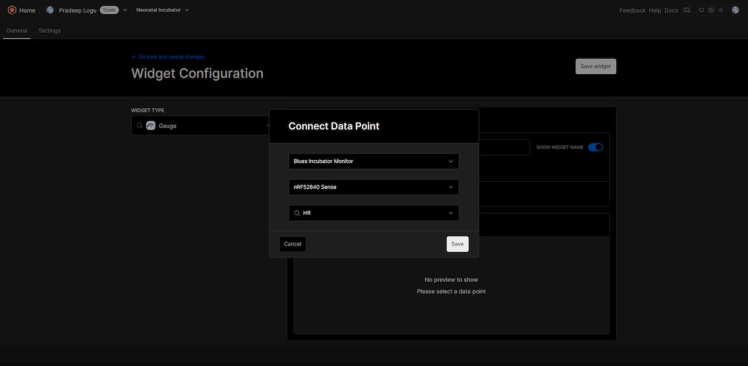
You can adjust the widget settings, such as title, size, color, data source, etc., in the configuration panel that appears after you choose the widget type. For example, we can name the temperature chart “Heart Rate”.
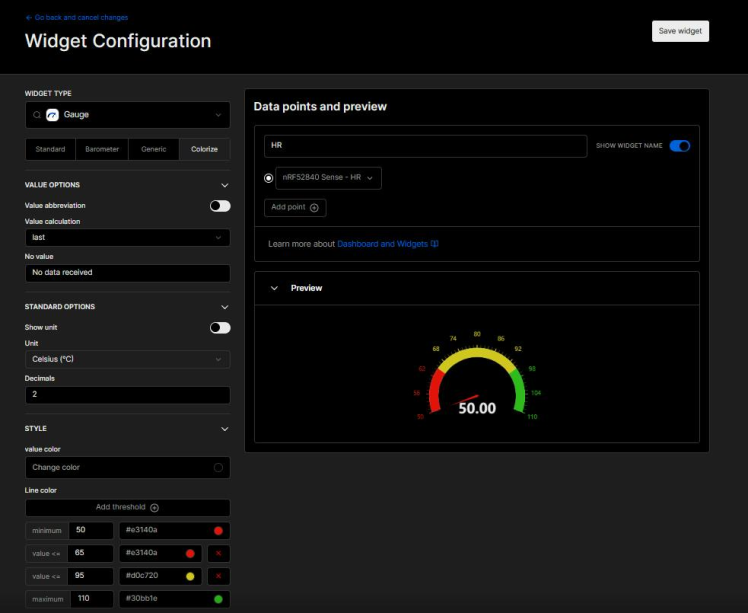
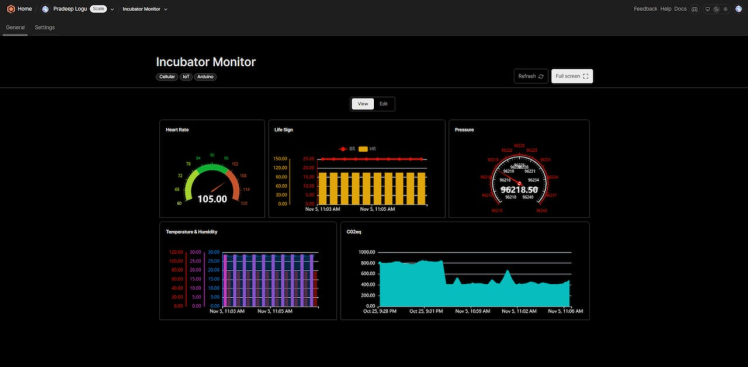
To finish, click on Save Dashboard. Repeat all data and arrange them by dragging and dropping. Click on the Preview Dashboard to see live data from your device.
Step 7️⃣- Webhook Trigger:
Next thing we need to define an alert engine, which can alert us when abnormal data is detected. Here in this case, I want to build an alert system that informs me when the temperature increases and Heart Rate anomalies.
For this navigate to the functions tab in the Qubitro project and create a new rule function.
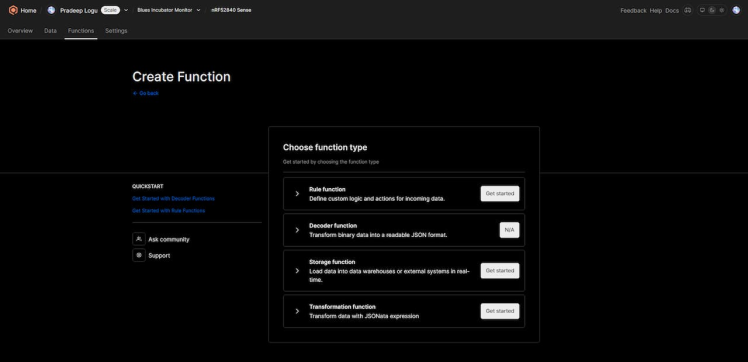
Then select the preferable option.
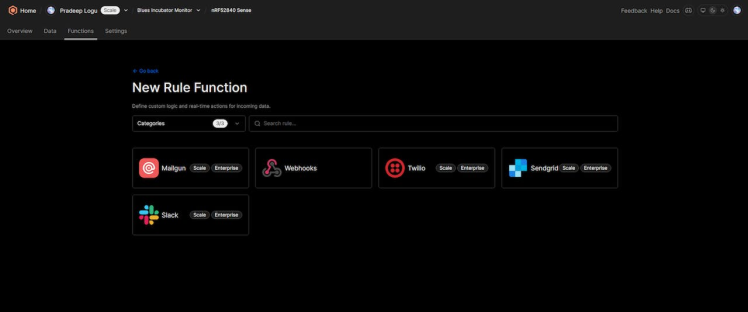
In this, I have selected a Webhook.
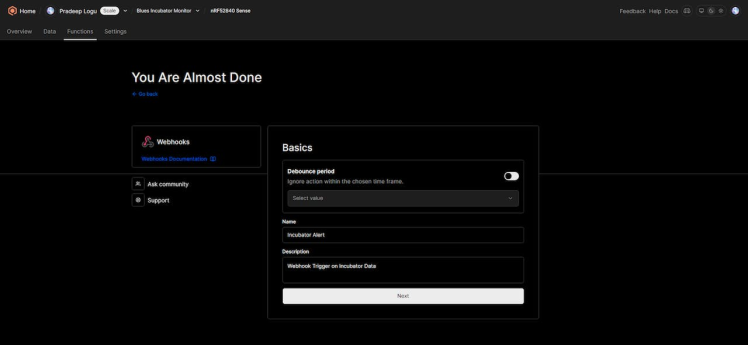
We can use demo webhooks for this.

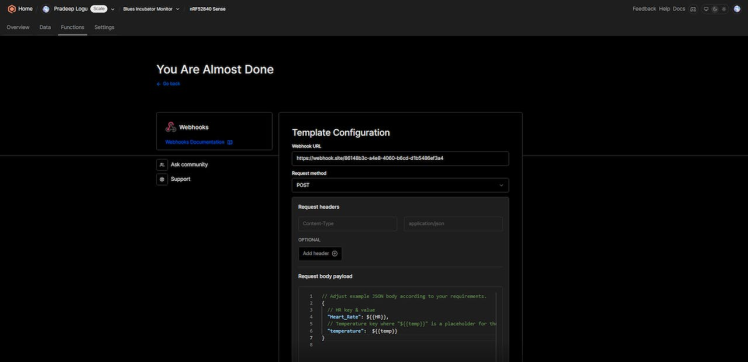
Copy and paste the webhook address on the Qubitro rule engine.
Then set the rule condition as per our need, here I have added temp and heart rate readings in the rule.
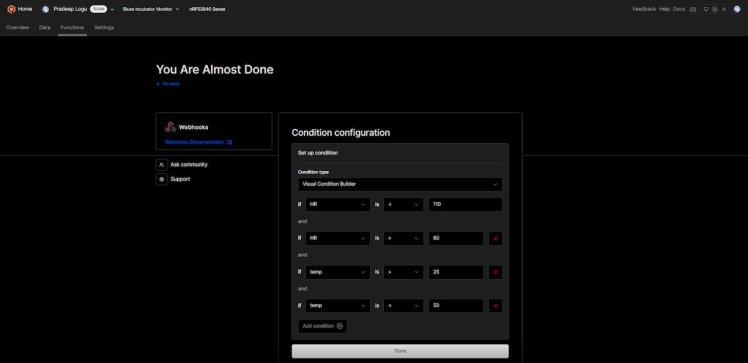
Next, click save and continue.
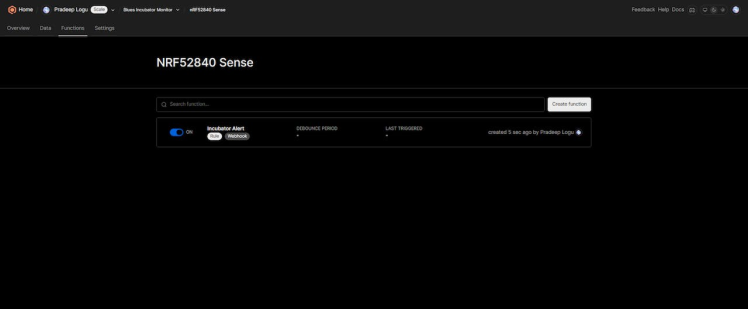
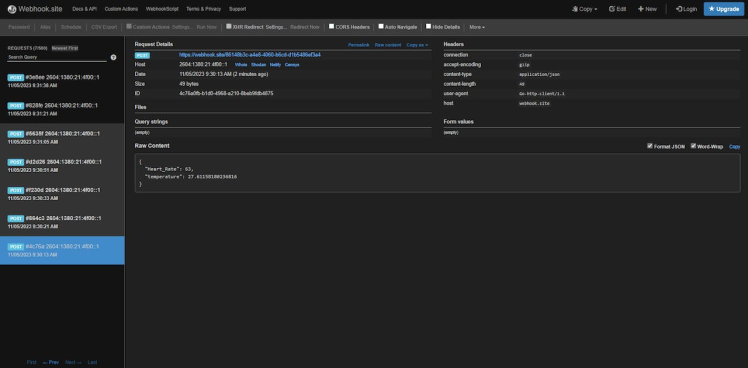
If the rule conditions are met, it will auto-trigger the webhook alert. Here is the sample response.
Wrap-Up:
This project shows how IoT can transform incubator monitoring and management. The system provides real-time data and alerts for optimal incubation conditions. It also enables remote monitoring for convenience and efficiency. Future work should overcome the challenges and improve the system’s reliability and performance. This project is a strong basis for the future of incubator monitoring systems, leading to more advanced and integrated solutions. To implement this project, I have used the Blues Cellular Notecard and Notecarrier-A, also you can use Blues Starter Kit which is a low-cost and easy-to-use IoT development platform.
The Blues Starter Kit is ideal for beginners who want to get started with IoT and learn how to build and deploy IoT solutions. I hope you enjoyed this project, and if you want to explore more possibilities, check out Blues Accelerators for inspiration.
Credits
Related products


Leave your feedback...