
How To Track The Iss Location With Node-red

Made by CETECH11 / Environmental Sensing / IoT
About the project
Will show you how to track ISS via Node-Red
Project info
Difficulty: Moderate
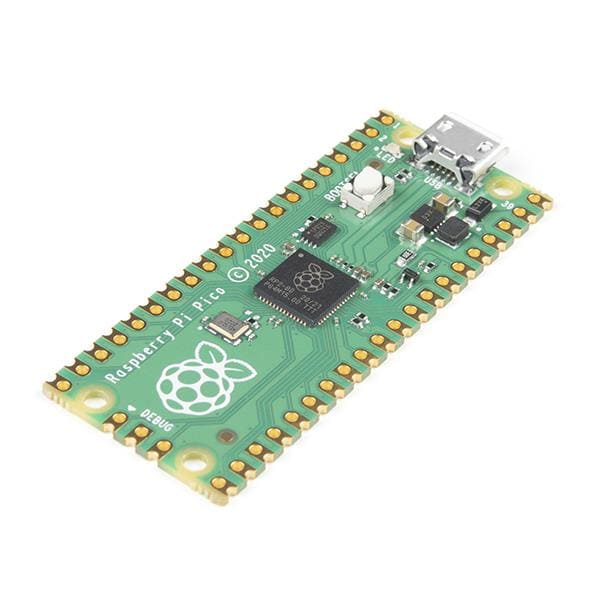
Platforms: Raspberry Pi, Node-RED
Estimated time: 1 hour
License: GNU General Public License, version 3 or later (GPL3+)
Items used in this project

Story
Node-RED is a visual programming tool that allows you to create flows of data and logic using nodes. In this article, we will use Node-RED to track the location of the International Space Station (ISS) and display it on a world map.
What You NeedTo follow this tutorial, you will need the following:
- A computer with Node-RED installed. You can download and install Node-RED from here.
- An internet connection to access the ISS location API and the world map node.
- Two Node-RED nodes:
node-red-contrib-iss-locationandnode-red-contrib-web-worldmap. You can install them from the Node-RED palette or by running the following commands in your Node-RED user directory, typically~/.node-red:
npm install node-red-contrib-web-worldmap
You must check out PCBWAY for ordering PCBs online for cheap!
You get 10 good-quality PCBs manufactured and shipped to your doorstep for cheap. You will also get a discount on shipping on your first order. Upload your Gerber files onto PCBWAY to get them manufactured with good quality and quick turnaround time. PCBWay now could provide a complete product solution, from design to enclosure production. Check out their online Gerber viewer function. With reward points, you can get free stuff from their gift shop. Also, check out this useful blog on PCBWay Plugin for KiCad from here. Using this plugin, you can directly order PCBs in just one click after completing your design in KiCad.
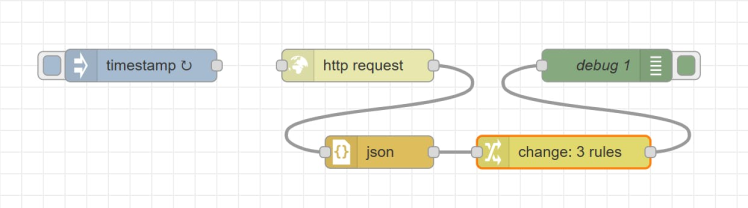
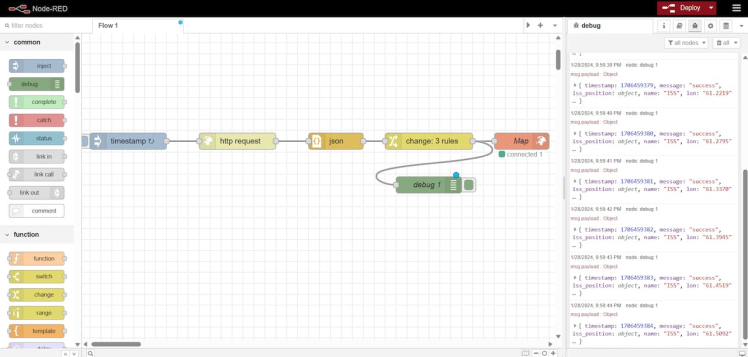
The FlowThe flow we will create consists of four nodes:
- An
injectnode that triggers the flow every 10 seconds. - An
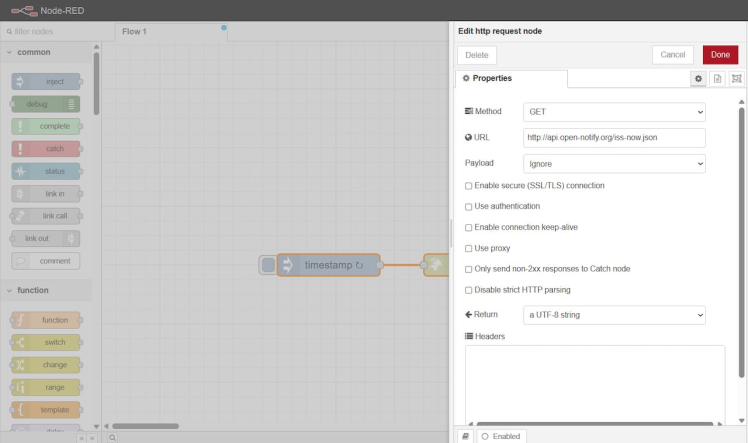
HTTP-requestnode that queries the ISS location API and returns the current latitude and longitude of the ISS. - A
functionnode that formats the location data into a message object that the world map node can use. - A
worldmapnode that displays a world map and a marker for the ISS location.
The flow looks like this:

Let’s take a closer look at each node and how to configure them.
The Inject NodeThe inject node is used to trigger the flow at regular intervals. To configure it, double-click on it and set the following properties:
- Name:
Every 10 seconds - Repeat:
interval - Every:
10seconds
This will make the node send a timestamp message every 10 seconds.

The ISS location node is used to query the ISS location API and return the current latitude and longitude of the ISS. To configure it, double-click on it and set the following properties:
- Name:
ISS Location - URL: api.open-notify.org/iss-now.json
This will make the node send a message object with the following properties:
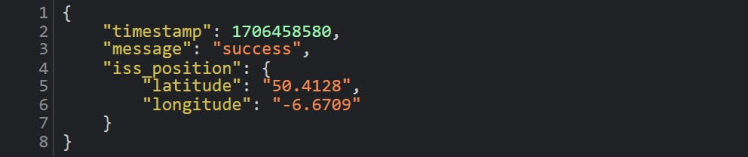
This node will return the following payload:
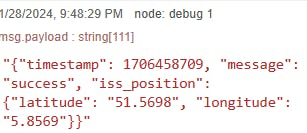
the return payload contains thefollowing properties:
latitude: a string indicating the current latitude of the ISS in degrees.longitude: a string indicating the current longitude of the ISS in degrees.
The function node is used to format the location data into a message object that the world map node can use.
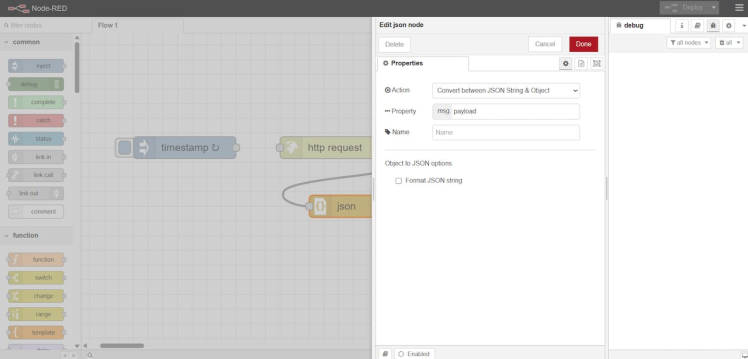
To configure it, double-click on the JSON node and set the following properties.
Next, set the following properties on the change node:

This will make the node send a message object with the same properties as the original message, except for the payload, which will be an object suitable for the world map node.
Here is the final transformed payload that the map node can understand.

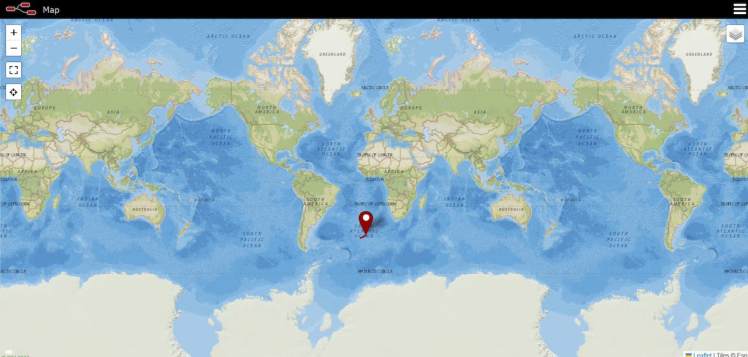
The world map node displays a world map and a marker for the ISS location. To configure it, double-click on it and set the following properties:
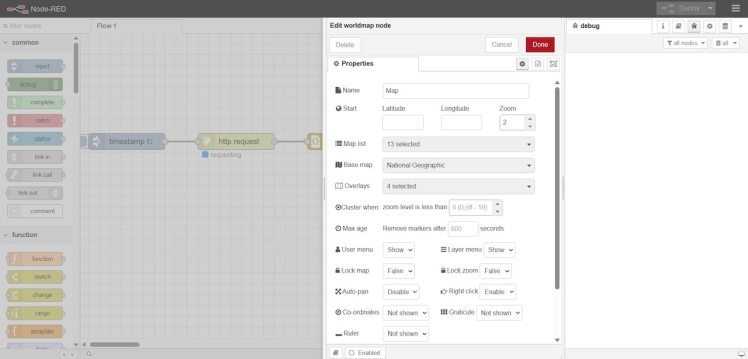
This will make the node display a world map widget on the dashboard, with various options to customize the view. The node will also listen for incoming messages with location data and display a marker on the map accordingly.
To see the result, deploy the flow and open the dashboard. You should see a world map with a blue globe icon indicating the current location of the ISS. The icon will move as the ISS orbits the Earth. You can also click on the icon to see the name and the coordinates of the ISS.
In this article, we have learned how to use Node-RED to track the location of the ISS and display it on a world map. We have used node-red-contrib-web-worldmap to query the ISS location API and display the map widget. We have also used a function node to format the location data into a message object that the world map node can use.
We hope you have enjoyed this tutorial and learned something new. If you want to learn more about Node-RED and its nodes, you can check out these web pages:
- Node-RED
- node-red-contrib-iss-location (node) - Node-RED
- node-red-contrib-web-worldmap (node) - Node-RED
Happy coding!
Credits
Related products


Leave your feedback...