
Beagleplay + Nodered

About the project
Use NodeRed to make a UI dashboard visual of your output!
Project info
Difficulty: Easy
Platforms: BeagleBoard, SparkFun, Node-RED
Estimated time: 1 hour
License: GNU General Public License, version 3 or later (GPL3+)
Items used in this project
Hardware components

Story
Hello Everybody! This will be a simple starter project to get you adjusted to NodeRed. I am a beginner, so hopefully my tutorial and tips will help you. This will be an extension of a previous project I did. You will need to go through that tutorial first, then join me back here for some NodeRed training. Let's get started!
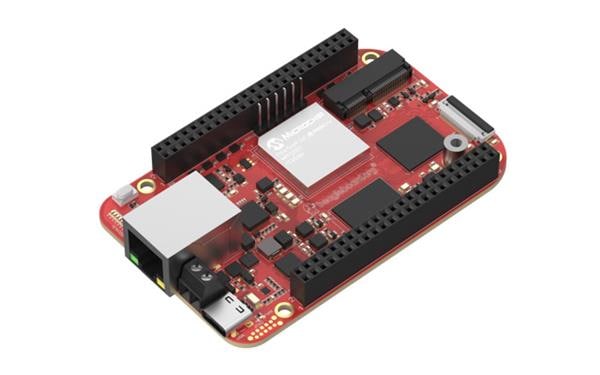
BeaglePlay + Qwiic Capactive Touch Slider
What is NodeRed?NodeRed is a programming tool for wiring together hardware devices along with application programming interfaces. It is a flow-based programming tool that uses "boxes" or nodes in your palette. Luckily for us, this programming tool is compatible with BeaglePlay.
What is NodeRed UI/Dashboard ?NodeRed dashboard utilizes the dashboard functions available in NodeRed to give your flow life! When I say life I just mean a visual of your flow! The dashboard functions give you that option with a gauge, text output, charts, buttons, audio, and even more choices to download.
Let's BeginFirst, you will want to download Node-Red on your BeaglePlay. I will post the instructions below for you all to follow.
Once you have NodeRed downloaded on your BeaglePlay, we can get started with the fun stuff. Begin running NodeRed, now you can open the editor in a website URL. You can access it with this URL: http://localhost:1880. You will input your local host or your IP Address. For example:
126.720.78.99:1880
Type "sudo ifconfig" on your terminal for play to find the IP address.
This website will give you access to the editor. Now we can begin making flows. We need the pythonshell node to get us started.
1. Download PythonshellSince BeaglePlay uses Linux OS and python, you will want to download the python shell. This node gives you access to execute the python script through NodeRed. Input of this node will become the argument for the python script. Once that is downloaded it will be readily available to use in the input section of your nodes. Instructions to download can be found in the pictures below.
1 / 4 • The pythonshell node!

The pythonshell node!

Click on the Three bars above the debug window to the right

Choose Manage palette

Select the "Install" tab and search the node you need!
2. Begin Flow WorkspaceNow you can start your flow in NodeRed. For this example I used the nodes : pythonshell, function, and debug. The specific dashboard nodes I used were the LED and Text. If you would like to download more dashboard nodes, you can download them the same way you downloaded the pythonshell node.
Drag the pythonshell Node onto the workspace from the palette (to the left of your workspace). Open the node and input your python code as pictured below. Make sure to select continuous when executing the python shell. You will always need a debug node to see the output of your program. Once those are wired together, deploy the flow by clicking the big red button in the corner labeled "deploy". This will give you the same output as your Linux OS in your debug window.
The inside of the pythonshell!

The inside of the pythonshell!
Quick Tip: Make sure to click to blue button next to your python node. This will run the program so you can see the output in the debug window to the right. Just click on the bug tab to the right of the workspace to open the debug window.
1 / 3 • Wire together the python node and debug

Wire together the python node and debug

The big bad deploy button!!

How to access your debug window and to see your functions output!
Now let's give this output an actual visual!
3. Introducing NodeRed UITo download this application the same way as the pythonshell down below in the "1. Downlaod Pythonshell". Search "node-red-dashboard" instead of "pythonshell".
If you are coming from my previous example, Hello! Also, I will be doing the example in the "How can I expand on this" section. To create a visual for NodeRed we will need to bring up the UI. You open the UI the same way you open the editor, just simply add /ui to the end. For example:
126.720.78.99:1880/ui
Now you can see the visuals that the dashboard nodes will give. I used the text and LED dashboard nodes. You may use whatever your imagination you would like to show the visual. I'll keep the example simple for this tutorial.
You will need to use a function node depending on the output you would like. For the text dashboard, I made a function to print the output. The function node utilizes JavaScript for programming. I did a program to print the different regions depending on the input. I will insert that below.
var region = msg.payload // integer initialized
var output = {};
if (region.startsWith("Pad.Left")) {
output.payload = "Left Pad";// print output
} else if (region.startsWith("Pad.Middle")) {
output.payload = "Middle Pad"; //print output
}
else if (region.startsWith("Pad.Right")) {
output.payload = "Right Pad"; //print output
}
else {
output.payload = "No Touch";//print output
}
return [output];
Input this code in your function block. This will print in a more formal format than "Pad.Left". Wire together the function with the pythonshell and debug node. You will see an output in the debug window, depending on what you programmed the output to be.
1 / 2 • A complete flow!

A complete flow!

The output with the function node.
Now onto the actual UI aspect of this step. The code used above is to print a text, therefore the text dashboard will be used. You must edit the group to create a tab for this specific output. Name it as you would like but mine is showed below.
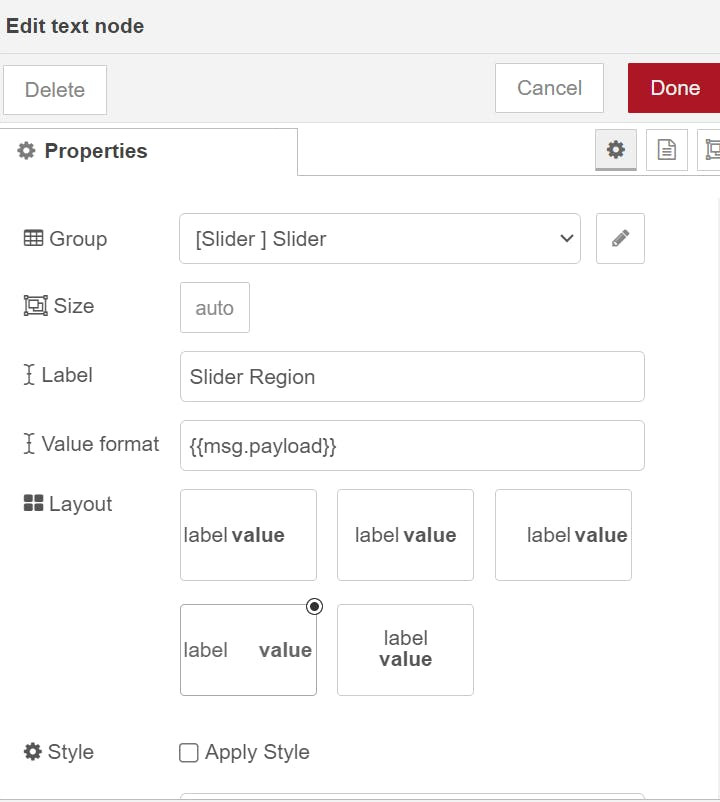
Without these specifications, you will not be able to see your output visually using dashboard. This gives the output a destination. Once that is done, you can wire everything together as pictured below.
A complete flow with all nodes!

A complete flow with all nodes!
I added the LED as a fun touch to the project. It will display a light depending on the region touched on the Capacitive touch slider. I have it to flash yellow for left, green for middle, and purple for right. This node is a simple true or false statement that requires no programming. You simply just change it how you see fit.
4. The Visual!Now that all of the work is done, we can see the output with the ui website. Open it as previously stated and your Tab should be on the left. Don't forget to run the python script like I told you to! Now we have an output of the different regions along with the LED flashing lights.
Credits
Related products


Leave your feedback...