
Store And Graph Ec/ph/orp Data With The Tick Stack And Nocan

Made by ufire
About the project
This will go over how to use the NoCAN Platform by Omzlo and uFire sensors to measure EC, pH and ORP with graphs by the TICK stack.
Project info
Difficulty: Easy
Platforms: Arduino, Raspberry Pi, Linux
Estimated time: 1 hour
License: GNU General Public License, version 3 or later (GPL3+)
Items used in this project
Hardware components

Story
This will go over how to use the NoCAN Platform by Omzlo and uFire sensors to measure EC, pH and ORP. As their website says, sometimes it's easier to just run some cable to your sensor nodes. CAN has the advantage of communication and power in one cable so signal and battery aren't issues. The firmware of the nodes can be simpler; no bothering with sleep modes or WiFi setup, for example. The NoCAN platform also has some great features like programming the nodes over the CAN bus.
The NoCAN platform uses a Raspberry Pi, so everything that can do will be available. We are going to take advantage of it by installing the TICK stack. That will let us use InfluxDB to store measurements. It is a timeseries based database purpose-made for this sort of thing. It also comes with Chronograf to make dashboards and display all of this data we are going to be taking. The T and K stand for Telegraf and Kapacitor. Telegraf sits inbetween the data you are sending and the Influx database. Kapacitor is the event engine. When something happens, it can send you a notification through a variety of methods. And, just because I like it better than Chronograf, I will install Grafana for dashboards.
Getting the Raspberry Pi Ready
Head over to the Rasbian Download page and download the image with the desktop and recommended software, then flash it onto an SD card.
After the image is on your SD card, you should have two volumes, root and boot. Open a terminal in boot and type:
touch ssh
That will enable SSH.
Then type:
nano wpa_supplicant.conf
And copy/paste the following after you've modified it for your own county and WiFi settings:
country=US
ctrl_interface=DIR=/var/run/wpa_supplicant GROUP=netdev
update_config=1
network={
    ssid="NETWORK-NAME"
    psk="NETWORK-PASSWORD"
}
The country codes come from here.
Enable SPI:
echo "dtparam=spi=on" >> config.txt
Put the SD card in your Raspberry Pi, wait a little bit and type:
ssh pi@raspberrypi.local
You should be at the login prompt. The password is raspberry.
Setting Up NoCAN
Omzlo provides a thorough install guide. But I decided to make it easier for myself and learn a little about Bash scripting. So get your Raspberry Pi started and SSH or serial terminal into it.
I learned that just as much development time can go into creating a good Bash script as whatever it is your are trying to actually install. There are 1000 ways to get something done, some simpler to grasp or execute than others. In the end, I didn't actually do much. If you execute:
wget https://ufire.co/nocan.sh && chmod +x nocan.sh && sudo ./nocan.sh
In your Raspberry Pi's terminal, it will download and execute the script.
Then it:
- Downloads the Omzlo NoCAN daemon and installs it in /usr/bin for easy access, makes a ~/.nocand folder and writes a very basic configuration file with the password set to 'password'. You should probably change it to something else, it's at ~/.nocand/config.
- Downloads the Omzlo NoCAN client and copies it in /usr/bin and creates a basic configuration file with the same password set. It's at ~/.nocanc.conf.
- Sets up a Systemd service that keeps the NoCAN daemon running.
- Writes a python file to ~/.nocand, nocan_ufire.py. It will talk to the NoCAN node's firmware and take EC, pH, and ORP measurements, parse the results and add them into the InfluxDB database.
- Adds InfluxData's repo to apt and installs the TICK stack. And since I prefer it over Chronograf, it installs Grafana as well.
- Creates a blank Influx database
Some gotchas you may run into:
The influx daemon might not be started in time to have the script add the database, type This script only works as the default pi user. You'll need to change pi to your username where appropriate if you are under a different user.
- Your locale may not be setup, so run dpkg-reconfigure locales
- The Grafana install might hang, so just try again.
- curl -i -XPOST http://localhost:8086/query --data-urlencode "q=CREATE DATABASE nocan"
The last thing is to add a cron job. I couldn't find a very good way to script this one, so type 'crontab -e' to edit manually and add '* * * * * python /home/pi/.nocand/nocan_ufire.py'.
Once that's all done, you can verify everything is setup and running as it should be. Grafana lives at http://[Raspberry Pi's Address]:3000/. You should see a login page, admin/admin is the default.
Chronograf can be found at http://[Raspberry Pi's Address]:8888/
Putting the uFire Hardware Together
Before we can assemble the hardware, there's one thing to address. The uFire ISE board can be used to measure both pH and ORP. The hardware is the same, but the software is different. Because the hardware is the same, that means the I2C address is, by default, the same as well. And the sensors communicate through I2C so one will need to be changed. For this project, we are going to pick one of the ISE boards and use it to measure ORP. Following the steps here, change the address to 0x3e.
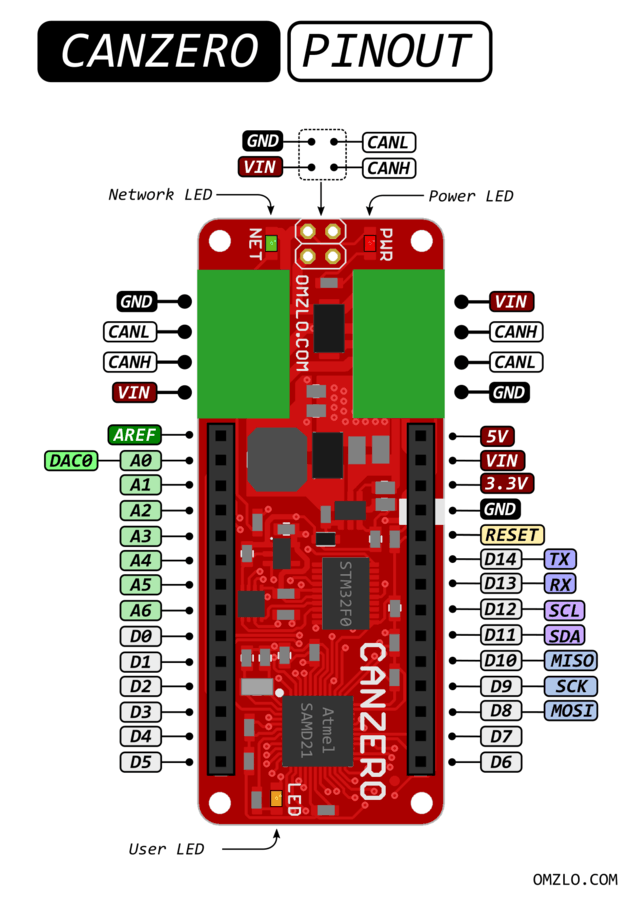
Now that the address is changed, putting the hardware together is easy. This setup is based on earlier work doing basically the same thing but using BLE rather than CAN to transmit data. You can read about it on the Arduino Project Hub. All the sensor devices use the Qwiic connect system so just connect everything together in a chain, there's only one way to insert the Qwiic to Qwiic wires. You'll need one Qwiic to Male wire to connect one of the sensors to the CANZERO node. The wires are consistent and color coded. Connect black to the node's GND, red to either the +3.3V or +5V pin, blue to the SDA pin which is D11, and yellow to the SCL pin on D12.
For this project, it will expect the temperature information to come from the EC sensor, so be sure to attach a temperature sensor to the EC board. All the boards have the ability to measure temperature though. Don't forget to attach the EC, pH and ORP probes to the appropriate sensors. They are easily attached with BNC connectors. If you have an enclosure, putting all this inside would be a good idea, especially considering water is going to be involved.
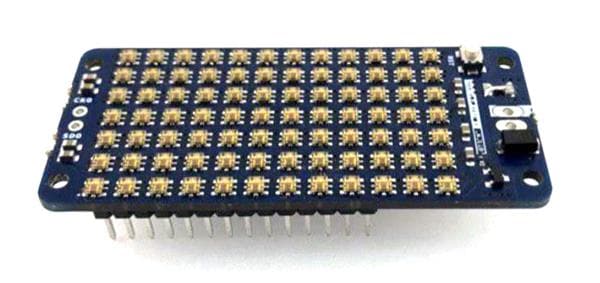
The NoCAN Hardware
Assembling the NoCAN hardware is also easy. Attach the PiMaster to the Raspberry Pi and find a suitable power supply for it.
Follow Omzlo's instructions on making cables for your project.
Deploy your node and find a place for the PiMaster.
Program the CANZERO Node
One of the great things about this setup is you can access the nodes even after they are deployed. They are programmed over the CAN wire, so you can re-program them anytime you want.
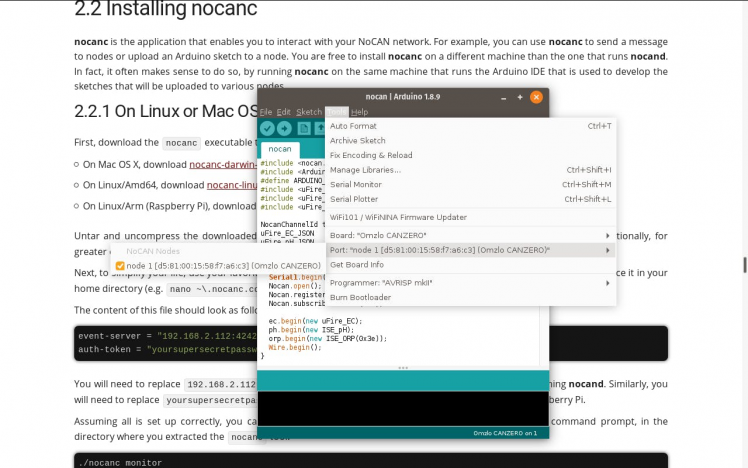
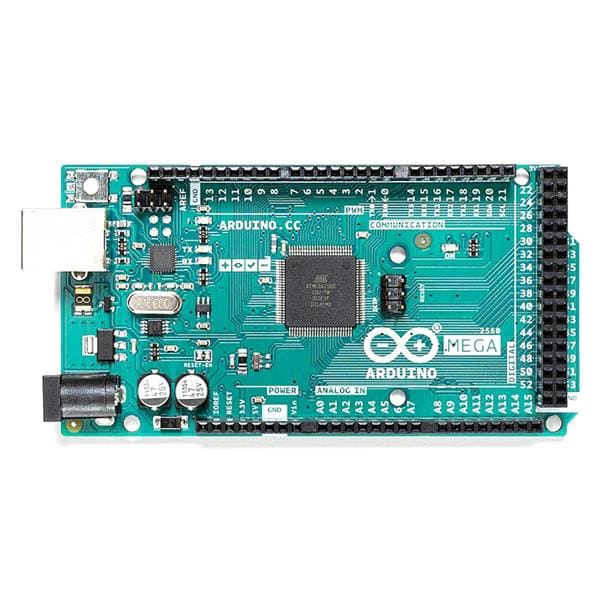
For that, you'll need the Arduino IDE installed, the PiMaster on your network, and your node connected to the CAN bus. You'll also need a program called nocanc installed on your development computer. All of that is described on Omzlo's installation page.
Visit GitHub and copy the code into a new Arduino IDE sketch. Change the board to Omzlo CANZERO and select the node in the 'Port' menu. Then just click upload like normal. If everything went according to plan, you should have a programmed node ready to take some measurements.
How Does All This Tie Together?
Now that all the software and hardware is set up, let's take a moment to talk about how all of it will actually work.And show off my GIMP skills...
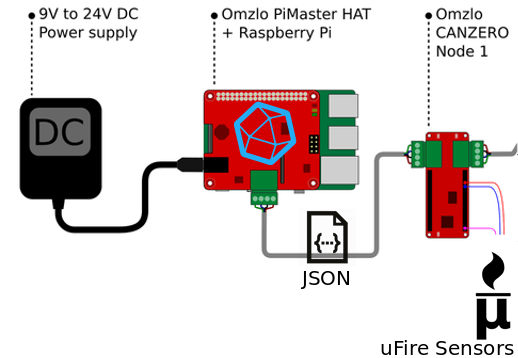
In summary:
- The CANZERO node is connected to the PiMaster and deployed somewhere
- Every minute a Cron job is run on the PiMaster. It will execute a python script.
- The python script will send a command to the node telling it to take a measurement or some other action.
- The node will execute what the command was and return a result in JSON format.
- The python script will receive that result, parse it, and update an InfluxDB with it.
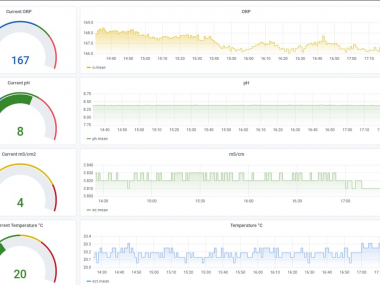
The last step is to watch the data collect in some nice looking charts.
Setting Up Chronograf or Grafana
The last thing to do is to set up some charts in Chronograf or Grafana.
You'll need to set up the data source. The defaults for InfluxDB are fine. The address for it is 'http://localhost:8086' and there is no username or password.
Both are similar in that they are organized into Dashboards that have any number of charts inside them. Both have an Explore area that allows you to see the measurements and interactively create charts. Remember the database name is 'nocan' and organized into several measurements with one value.
Like I mentioned, I prefer Grafana because it is more configurable than Chronograf. It is also mobile-friendy, where Chronograf is not. The charts are easily embedded and shared
Improvements
- You can set the host name of your Raspberry Pi to access it easier on your network. You can do that in raspi-config. I changed mine to nocan, so I was able to go to nocan.local to access it (doesn't work on Android).
- You can install a program like ngrok to access your Raspberry Pi outside of your network.
- Use one of the methods Kapacitor provides to provide notifications.
- Add more sensors, of course.
Code
Credits
Related products


Leave your feedback...