
Raspberry Pi System Monitor

Made by Aula_Jazmati / Displays / Games & Gaming / Kids & Family / Notifications
About the project
A real-time system monitoring tool for Pi that tracks CPU usage, memory consumption, & temperature with live graphs &data export capability.
Project info
Items used in this project

Story
This project presents the design and implementation of a real‑time system monitoring tool for the Raspberry Pi. The application provides a graphical interface to track key performance metrics — including CPU usage, memory consumption, and processor temperature — in real time. Built with PyQt5 for the GUI, PyQtGraph for live data visualization, and psutil for system metric retrieval, the tool offers both visual feedback through dynamic progress bars and plots, and the ability to export collected data to CSV for later analysis. By combining hardware‑specific commands (such as vcgencmd) with cross‑platform Python libraries, the project demonstrates how to integrate low‑level system information into an interactive, user‑friendly dashboard. This makes it a valuable educational resource for learners interested in embedded systems, GUI development, and performance analysis.
- By completing this project, learners will be able to:
- Understand the fundamentals of building desktop GUI applications using PyQt5.
- Implement live data visualization with PyQtGraph.
- Retrieve and process system metrics (CPU, RAM, temperature) using psutil and Raspberry Pi‑specific commands.
- Design and organize application code for clarity, maintainability, and scalability.
- Store and export time‑stamped performance data in CSV format for offline analysis.
- Apply concepts of event‑driven programming using timers and signal–slot connections.
- Enhance user experience through visual cues such as dynamic color changes and progress indicators.
- Deploy a Python‑based GUI application on a Raspberry Pi and configure it for autostart.
1. GUI Framework: PyQt5
PyQt5 is a comprehensive set of Python bindings for the Qt application framework, which allows creation of cross-platform GUI applications.

Key PyQt5 Components Used:
# Core PyQt5 imports
from PyQt5.QtWidgets import (QApplication, QWidget, QVBoxLayout, QHBoxLayout,
                             QLabel, QProgressBar, QPushButton, QFileDialog,
                             QGroupBox, QGridLayout)
from PyQt5.QtCore import QTimer, Qt
from PyQt5.QtGui import QFont, QPalette, QColor- QApplication: Manages the GUI application's control flow and main settings
- QWidget: Base class for all UI objects
- Layout Managers (QVBoxLayout, QHBoxLayout, QGridLayout): Arrange widgets in the window
QVBoxLayout: Arranges widgets vertically
QHBoxLayout: Arranges widgets horizontally
QGridLayout: Arranges widgets in a grid
- QLabel: Displays text or images
- QProgressBar: Provides a horizontal or vertical progress bar
- QPushButton: Creates a command button
- QFileDialog: Dialog that allows users to select files or directories
- QGroupBox: Group box frame with a title
- QTimer: Provides repetitive and single-shot timers
Examples:
1. Creating an application
from PyQt5.QtWidgets import QApplication, QWidget

# Only needed for access to command line arguments
import sys

# You need one (and only one) QApplication instance per application.
# Pass in sys.argv to allow command line arguments for your app.
# If you know you won't use command line arguments QApplication([]) works too.
app = QApplication(sys.argv)

# Create a Qt widget, which will be our window.
window = QWidget()
window.show()  # IMPORTANT!!!!! Windows are hidden by default.

# Start the event loop.
app.exec()


# Your application won't reach here until you exit and the event
# loop has stopped.
2. QMainWindow
import sys
from PyQt5.QtWidgets import QApplication, QPushButton

app = QApplication(sys.argv)

window = QPushButton("Push Me")
window.show()

app.exec()
3. Sizing windows and widgets
import sys

from PyQt5.QtCore import QSize, Qt
from PyQt5.QtWidgets import QApplication, QMainWindow, QPushButton


# Subclass QMainWindow to customize your application's main window
class MainWindow(QMainWindow):
    def __init__(self):
        super().__init__()

        self.setWindowTitle("My App")

        button = QPushButton("Press Me!")

        self.setFixedSize(QSize(400, 300))

        # Set the central widget of the Window.
        self.setCentralWidget(button)


app = QApplication(sys.argv)

window = MainWindow()
window.show()

app.exec()
2. Visualization Library: PyqtGraph
PyQtGraph is used to render live, high‑performance plots of CPU usage, memory consumption, and temperature.
PlotWidget – Embeds a plotting area into the PyQt5 layout.
PlotDataItem – Represents the live curve for each metric, updated in real time.
mkPen – Customizes line color and thickness for clarity
3. System Monitoring: psutil and vcgencmd
- psutil – Retrieves CPU usage, per‑core statistics, and memory utilization.
- vcgencmd – Raspberry Pi‑specific command to read CPU temperature and throttling status.
Data is collected at one‑second intervals and stored in collections.deque buffers for plotting and export.
4. Data Export – CSV
- csv module – Writes time‑stamped metric data to a CSV file for offline analysis.
- QFileDialog – Lets the user choose the save location interactively.
1. Application Initialization
def __init__(self):
    super().__init__()
    # Window setup
    self.setWindowTitle("Raspberry Pi System Monitor")
    self.setGeometry(100, 100, 800, 700)

    # Apply dark theme
    self.apply_dark_theme()

    # Setup UI components
    self.setup_ui()

    # Initialize data storage
    self.timestamps = collections.deque(maxlen=3600)
    self.cpu_data = collections.deque(maxlen=3600)
    self.ram_data = collections.deque(maxlen=3600)
    self.temp_data = collections.deque(maxlen=3600)

    # Setup update timer
    self.timer = QTimer()
    self.timer.timeout.connect(self.update_stats)
    self.timer.start(1000)  # Update every second
2. UI Setup Method
def setup_ui(self):
    # Main layout
    main_layout = QVBoxLayout()

    # Title
    title = QLabel("Raspberry Pi System Monitor")
    title.setAlignment(Qt.AlignCenter)
    main_layout.addWidget(title)

    # Metrics grid
    grid_layout = QGridLayout()

    # CPU group
    cpu_group = QGroupBox("CPU Performance")
    cpu_layout = QVBoxLayout()
    self.cpu_label = QLabel("CPU Usage: 0%")
    self.cpu_bar = QProgressBar()
    cpu_layout.addWidget(self.cpu_label)
    cpu_layout.addWidget(self.cpu_bar)
    cpu_group.setLayout(cpu_layout)

    # Add to grid
    grid_layout.addWidget(cpu_group, 0, 0)

    # Add grid to main layout
    main_layout.addLayout(grid_layout)

    # Graphs
    graph_layout = QHBoxLayout()
    self.cpu_plot = pg.PlotWidget(title="CPU Usage (%)")
    graph_layout.addWidget(self.cpu_plot)
    main_layout.addLayout(graph_layout)

    # Buttons
    button_layout = QHBoxLayout()
    self.save_button = QPushButton("Save Data")
    self.save_button.clicked.connect(self.save_data)
    button_layout.addWidget(self.save_button)
    main_layout.addLayout(button_layout)

    self.setLayout(main_layout)
3. Data Collection Methods
def get_cpu_temp(self):
    """Read CPU temperature from Raspberry Pi specific command"""
    try:
        res = os.popen("vcgencmd measure_temp").readline()
        temp_str = res.replace("temp=","").replace("'Cn","")
        return float(temp_str)
    except:
        return None

def update_stats(self):
    """Collect and update all system metrics"""
    if self.paused:
        return

    # Get system metrics
    cpu = psutil.cpu_percent()
    ram = psutil.virtual_memory().percent
    temp = self.get_cpu_temp()
    timestamp = datetime.datetime.now().strftime("%Y-%m-%d %H:%M:%S")

    # Update UI components
    self.cpu_label.setText(f"CPU Usage: {cpu}%")
    self.cpu_bar.setValue(int(cpu))
    self.style_bar(self.cpu_bar, cpu, 50, 80)

    # Store data
    self.timestamps.append(timestamp)
    self.cpu_data.append(cpu)

    # Update graphs
self.cpu_curve.setData(list(self.cpu_data))1. Environment Setup
- Install Python 3 and required packages:
# Install required packages
sudo apt update
sudo apt install python3-pyqt5 python3-psutil python3-pyqtgraph libraspberrypi-bin

# Or using pip
pip3 install PyQt5 psutil pyqtgraph
2. Application Skeleton
Create the main window class inheriting from `QWidget`.
- Initialize the application (`QApplication`) and set window properties.
3. UI Layout
- Use `QVBoxLayout` for the main container.
- Add `QGroupBox` sections for CPU, RAM, and Temperature.
- Insert `QProgressBar` and `QLabel` widgets for each metric.
- Add `PlotWidget` instances for live graphs.
4. Data Acquisition
- Implement `update_stats()` to read CPU, RAM, and temperature values.
- Append new readings to `deque` buffers.
- Update progress bars and plot curves.
5. Styling and Feedback
- Apply a dark theme or custom palette for readability.
- Change progress bar colors dynamically based on thresholds.
6. Data Export
- Implement `save_data()` to open a file dialog and write buffered data to CSV with timestamps.
7. Testing and Optimization
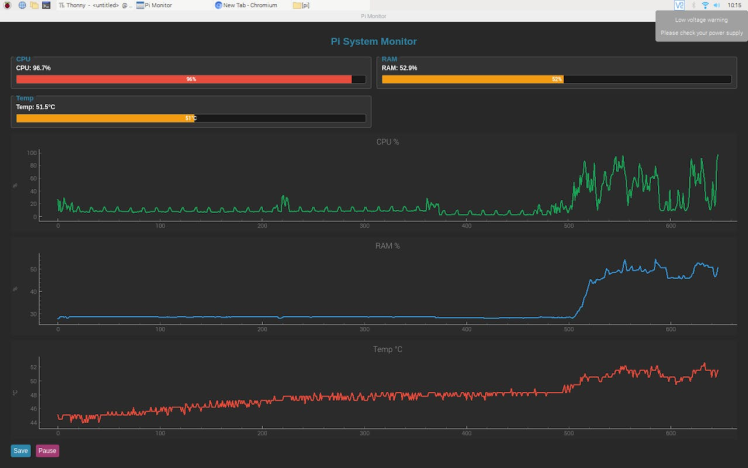
Raspberry Pi System Monitor GUI Test 1
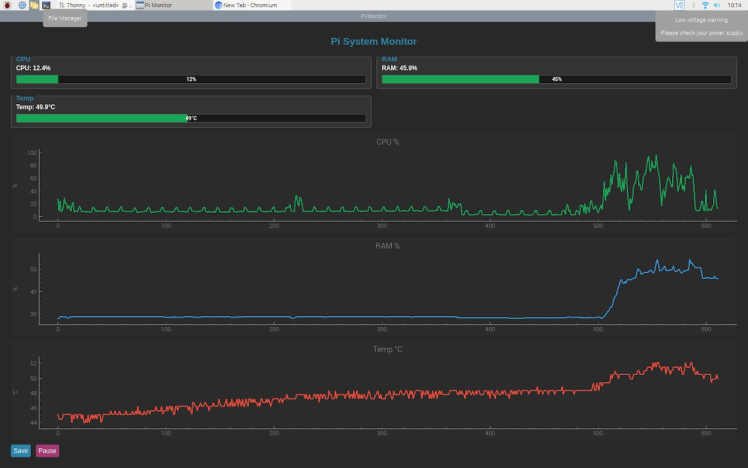
Raspberry Pi System Monitor GUI Test 1
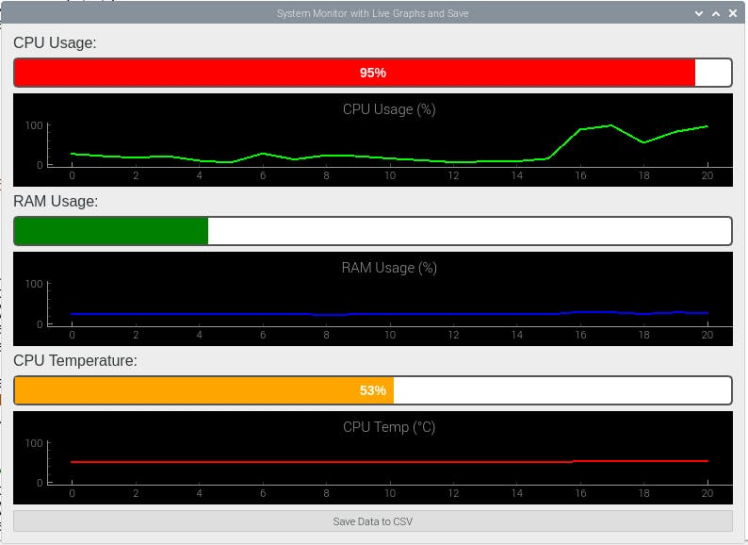
Raspberry Pi System Monitor GUI Test 2
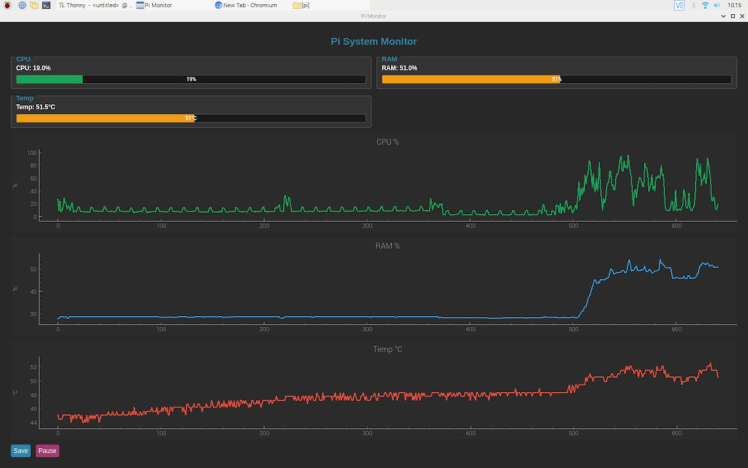
Raspberry Pi System Monitor GUI Test 2
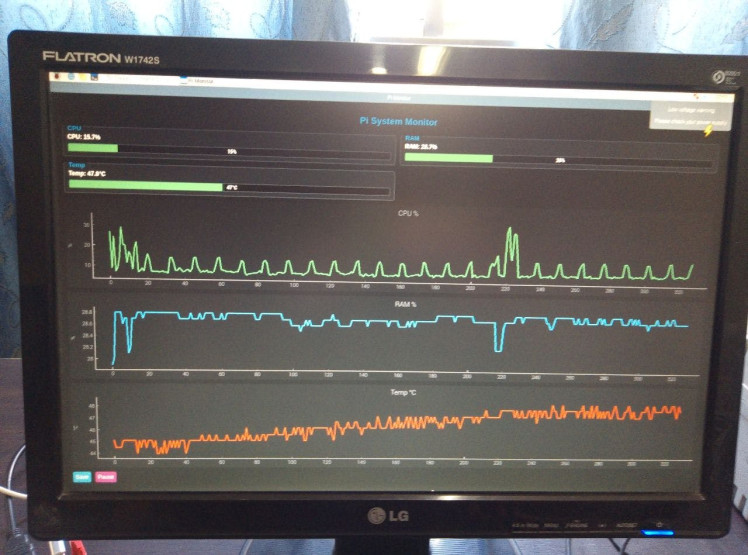
Raspberry Pi System Monitor GUI Test 3
Raspberry Pi System Monitor GUI Test 3
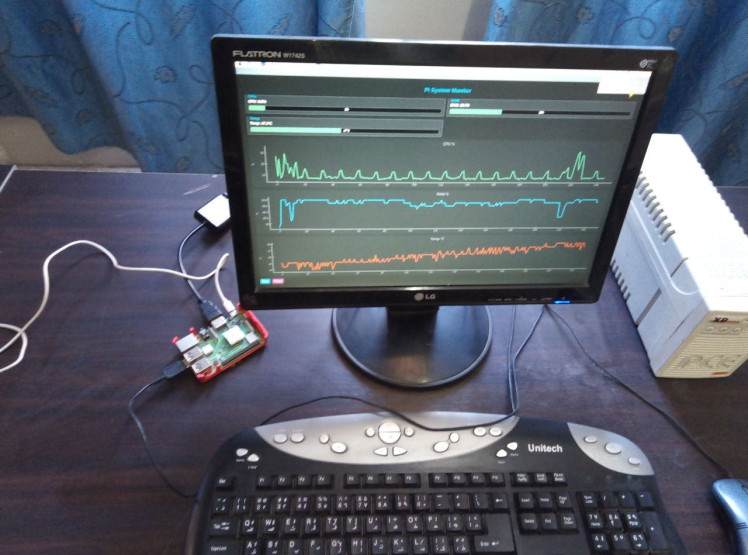
Mini Pi Monitor GUI Test
Mini Pi Monitor GUI Test
1 / 2
8. Deployment
- Create a `.desktop` file in `~/.config/autostart` for automatic launch at boot.
- Optionally package the script and dependencies for easy installation.
# ~/.config/autostart/pypimon.desktop
[Desktop Entry]
Type=Application
Name=PyPiMon System Monitor
Exec=python3 /path/to/pypimon.pyThe Raspberry Pi System Monitor project successfully integrates GUI development, real‑time data visualization, and system‑level monitoring into a single, user‑friendly application. By leveraging PyQt5 for the interface, PyQtGraph for high‑performance plotting, and psutil/vcgencmd for metric collection, the tool provides immediate insight into the Pi’s operational state.
From an educational perspective, the project demonstrates how to:
- Combine multiple Python libraries to solve a practical problem.
- Structure a GUI application for maintainability.
- Work with event‑driven programming and timed updates.
- Bridge hardware‑specific commands with cross‑platform code.
The resulting application is not only a functional monitoring tool but also a versatile teaching aid. It can be extended with additional metrics (network, disk I/O), alert systems, or remote monitoring capabilities, making it a strong foundation for further exploration in embedded systems and Python GUI programming.
Future Work
Future enhancements could include adding per‑core CPU, network, and disk monitoring for a more complete system view. Customizable alerts with visual, audio, or remote notifications would improve responsiveness to critical events. Automatic CSV rotation and in‑app data viewing could support long‑term logging and analysis. UI improvements such as theme switching, resizable panels, and multi‑language support would enhance usability. A headless mode with a web interface or API could enable remote monitoring from other devices. Educational features like an “explain mode” and modular exercises would make the tool a richer learning resource.
Schematics, diagrams and documents
Code
Credits
Related products


Leave your feedback...