
Graphic Representaton Of Heart Rate Variability

Made by StanChicago / Fitness / Health / Sensors
About the project
HRV data recordered from KYTO pulse sensor and displayed as Poincare plot on Android device
Project info
Difficulty: Moderate
Platforms: Android, Arduino, MIT App Inventor
Estimated time: 3 days
License: GNU General Public License, version 3 or later (GPL3+)
Items used in this project
Hardware components

Story
This project uses ear-lobe pulse rate sensor from KYTO Fitness company; this sensor produces heart rate data which is transmitted to Android device (smartphone or a tablet) using BlueTooth Low Energy(BLE) communication protocol. Android device displays received data in a form of Poincare plot. This is a special type of Heart Rate Variability (HRV) visualization; it allows immediately estimate heart condition is some cases without calculations or off-line analysis. Android application created with MIT Inventor framework
Details
Simply speaking if the heart is compared to an engine, when in idle mode it does not maintain steady rpm; that means, intervals between heart beats at rest are not exactly the same, they have some pseudo-random variability. When the heart works with increased rate, these intervals becomes less stochastic and better maintain a steady rhythm. The meaning and nature of heart rate variability is currently a subject of multiple scientific researches. Here is an excerpt from a popular article on HRV I found at the blog of Bryn Farnthworth:
One of the first things to know when understanding heart rate is that the most informative metric relies not just on the heart rate, but how much the heart rate varies. What’s often at first glance counter-intuitive about this metric is that a higher heart rate variability (HRV) is associated with good health – the more your heart jumps around (to an extent, of course), the readier you are for action. On the other hand, a low HRV is associated with ill health – it is a significant predictor of mortality from several diseases.
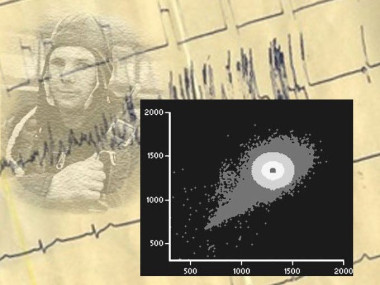
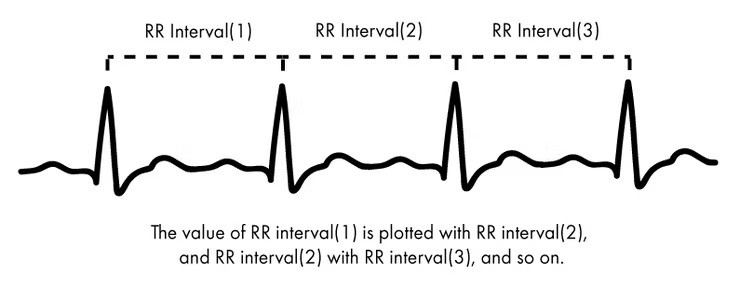
One of the most common visualization methods of HRV is a graph called a Poincaré plot. Named after the illustrious French mathematician, the graph plots the RR intervals (the distance between each heartbeat), with the RR interval just prior. This is explained further below.
The Poincaré plot therefore shows how well each RR interval predicts the next – a greater spread of values would mean an increased HRV, while the closer they bunch together, the less HRV there is. Two examples of Poincaré plots are shown below – the left shows a high heart rate variability, while the right shows a limited heart rate variability.

I strongly recommend to read the whole article from this blog, it is quite professional and at the same time delivers in a very clear and simple words.
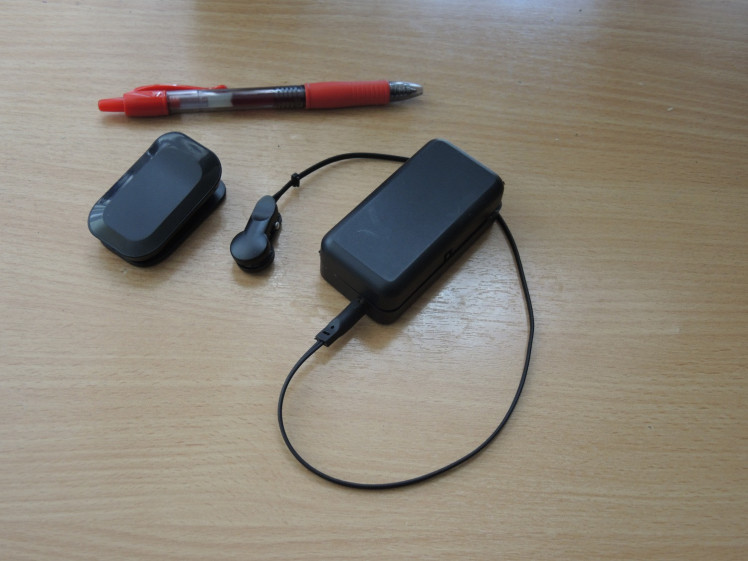
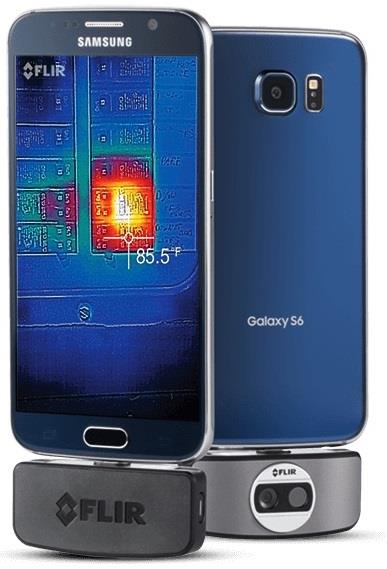
For this project I am using two 'flavors' of the same heart rate sensors. The sensor itself is a small clip attached to the earlobe. Kyto Fitness offers a wireless gadget that includes this clip and a small BLE transmitter with battery. They also offer some Android app capable of receiving and presenting the data transmitted by this gadget. Here is how sensor and BLE part looks: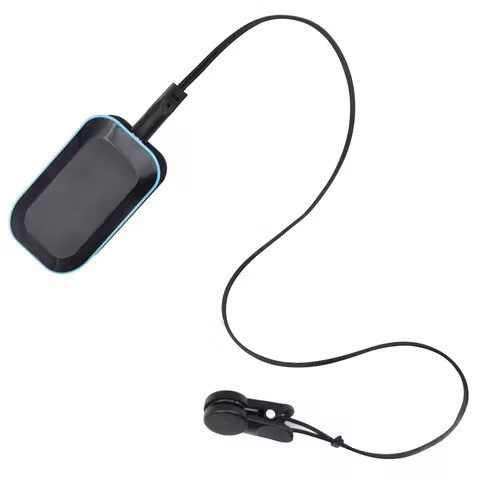
Bluetooth Mobile Heart Rate HRV Monitor with Ear Clip Sensor - KYTO2935
The data is transmitted in accordance with official BlueTooth Low energy Generic Attribute Profile (GATT) documents and standards; these standards describe in every detail how different sensors (this is called 'server' in BLE world) must communicate with host device (this is called 'client', quite confusing I think).
I am not going into formal description of BLE protocol here, but for practical purpose here is the specs I was using in this application:
In order to connect with KYTO heart rate wireless sensor the host device must use following 'addresses' (these 16-byte HEX numbers are called 'Service' and 'Characteristic'):
- 0000180D-0000-1000-8000-00805F9B34FB - service
- 00002A37-0000-1000-8000-00805F9B34FB - characteristic
- these are official specifications for Heart Rate sensors.
All these addresses are different only in first 8 bytes, everything else is always the same and is called 'Base Universally Unique Identifier' (Base UUID)
Besides wireless device from KYTO I also used a combination of the same sensor with it's own controller, simple Arduino board and popular HM10 BLE transmitter.
Service and characteristic of HM10 breakout are
- 0000FFE0-0000-1000-8000-00805F9B34FB (Service)
- 0000FFE1-0000-1000-8000-00805F9B34FB (Characteristic)
After connection with sensor is established, sensor start transmitting data, data format is described in available documents.
The example data package looks like:
(hex) 0x10 0x4C 0x15 0x03
Here first 2 bytes 10 are a set of flags;
second word 4C is dec 76 and this is a pulse rate (bpm);
third and second words must be read in reverse order (little endian format) so it is
03 15 (Hex)= 789 Dec. Here 789 is RR interval in 1/1024 sec, so to convert it into seconds we need to multiply it by 0.001024 which makes 0.808 sec.
One package might contain multiple RR intervals (practically, mostly 1 and sometimes 2) and in this case there might be words 5 and 6 for another interval and so on.
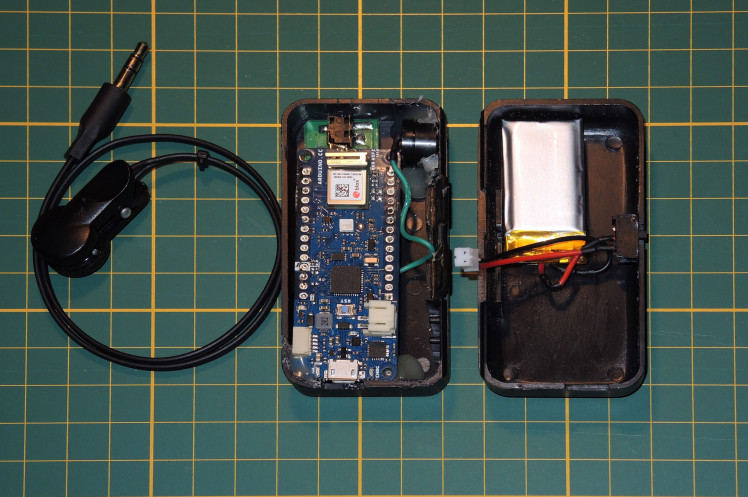
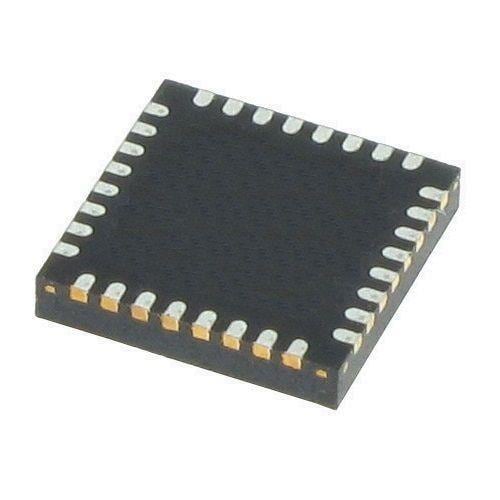
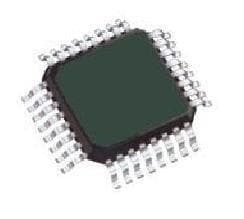
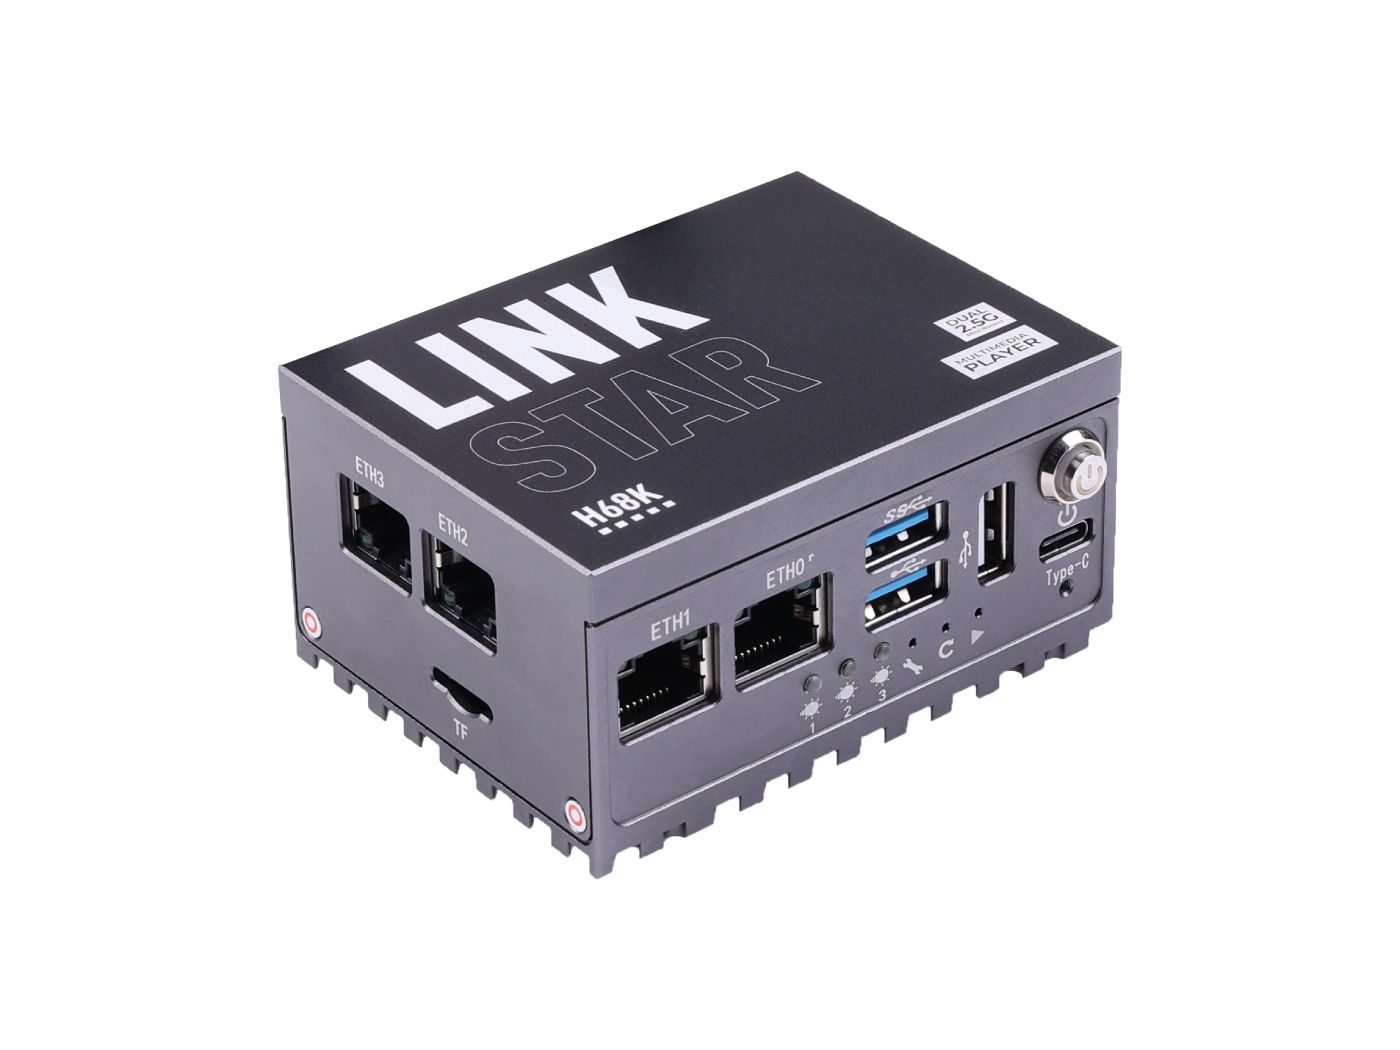
Sensor and controller were purchased from SeedStudio, but it seems like it is also manufactured by KYTO Fitness:
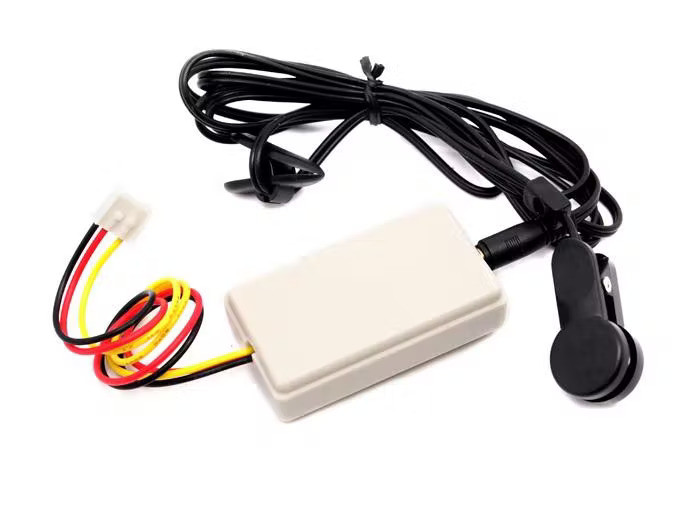
The controller board can also be purchased separately, without the case:

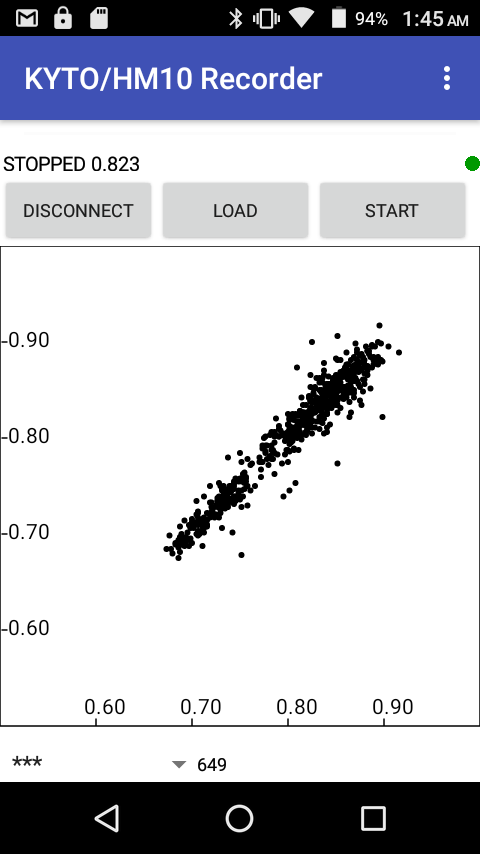
Originally I was planning to use only KYTO Wireless sensor; but while working on this project I was surprised to learn that wireless gadget has low precision, much lower then the same sensor with controller(above). Looks like wireless unit uses intensive data post-processing prior to transmission; as a result the granularity of transmitted values of RR-intervals is lower then I expected. The rounding of intervals values obviously sacrificed data precision. I will demonstrate this below when comparing diagrams received from wireless device and from sensor combined with Arduino.
The software part of this project is Android application that receives RR-intervals from sensor via BLE and displays them as a chart. Naturally, application allows to save received data as a .csv file and also load and display previously saved files.
I am not a Android programmer and I decided not to utilize over-complicated Android Studio software for creating my simple demo application. After some research I found amazingly simple but still powerful enough framework by MIT - MIT App Inventor.
This framework allows to make Android programs without coding, only using visual blocks that can be combined in multiple ways. Although it's possibilities are somewhat limited, I was amazed how simple and still powerful this programming environment is. I am attaching .apk - file of the program I made, it can be easily installed on any Android device. I am also attaching .aia file - this is a source code for MIT App Inventor and it can be loaded into Inventor framework if somebody wants to see the implementation details.
Working with MIT Inventor you have to deal with 2 major views - first, there is a design view which shows GUI part of your program. Here is how it looks for this project:
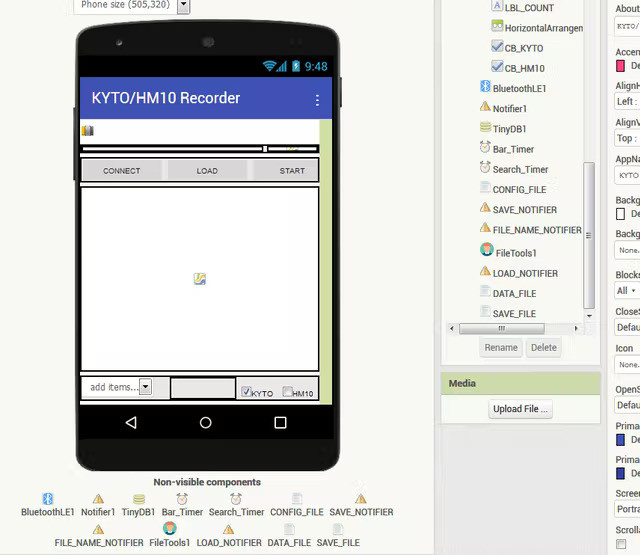
I used all standard GUI elements for this application (those that are built into MIT Inventor framework). I still had to use 1 non-standard element (they are called 'extensions') and this is a file browser, developed by Sunny Gupta.
Second type of views you have to deal with - is so called 'Blocks view' and this is where you create a 'code' - as a combination of functional blocks. Here is how part of it looks for my project:
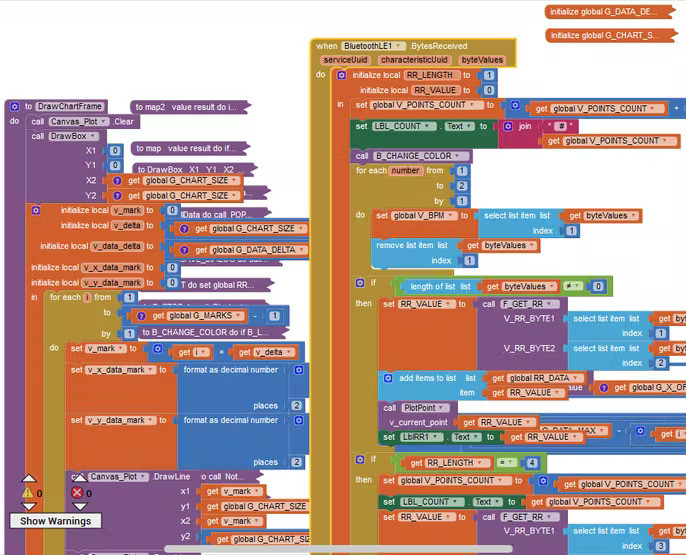
I suppose this project can be used as an example on how to arrange BLE communication and also how to represent data as a chart with zoom and pan functionality.
Here is a demo of application working:
Hardware part of project:
KytoFitness commercial device compared to my arduino-based transmitter:
I was surprised to see the data from commercial transmitter has quite low granularity (obviously, due to over-averaging). Here is a sample screen of data received from Kyto device:
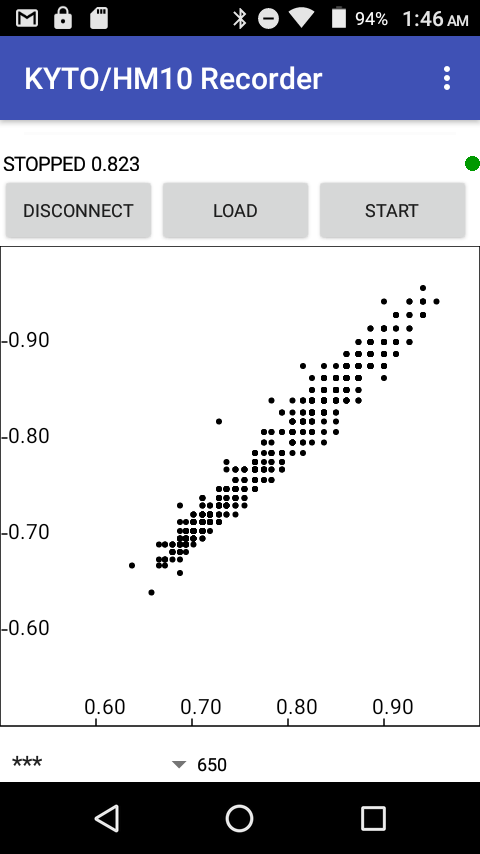
compared to the plot with the same number of points recorded from my device:
Comment: the name 'HM10 recorder' comes from the initial version of project where transmission part contained standard Arduino UNO and HM10 BLE transmitter. Finally I replaced these two parts with a single Arduino MKR WiFi 1010 board that combines microcontroller and BLE transmitter along with LiPo charger. This allowed to make hardware part small and totally portable.
Arduino code for transmitter:
/************************************************************
* DETAILS:  transmit data from  pulse sensor using standalone controller board.
* sensor on digital pin 2
* Uses ArduinoBLE library
* Data format:
* byte 1 - flag, 0x10
* byte 2 - uint8 BPM
* byte 3 - lower 8 bit of RR (rr - unit16)
* byte 4 - upper 8 bit of RR
* Hardware serial is used for debugging, shows BLE transmitter output
* HM10: 0000FFE0-0000-1000-8000-00805F9B34FB
*       0000FFE1-0000-1000-8000-00805F9B34FB
* Special about MKR1010: 1. Connect to PC via  USB host
*                       2. Don't use pin 11 for buzzer (pin 7 works)
*                       3. Don't use pin 2 for external interrupt.
*                       available pins: 0, 1, 4, 5, 6, 7, 8, 9, A1, A2
/************************************************************/

#include <ArduinoBLE.h>
const byte interruptPin = 4;
volatile boolean data_arrived=false;
boolean keep_running=true;
uint16_t v_rr=837;
byte v_bpm;
uint8_t data_array[4];
unsigned long current_time,previous_time;
BLEService HM10_Service("FFE0");
BLECharacteristic heartRate("FFE1",BLERead | BLENotify,4);
BLEDevice host_device;

void beep(byte n, byte pin_no){
  tone(pin_no,4200);
  delay(n);
  noTone(pin_no);
  }

void setup()
{
Serial.begin(9600);
Serial.print("Sketch:   ");   Serial.println(__FILE__);
Serial.print("Uploaded: ");   Serial.println(__DATE__);
if (!BLE.begin()) {
    Serial.println("starting BLE failed!");
    while (1);
  }
  data_array[0]=0x10;
  data_array[1]=70;
  data_array[2]=v_rr & 0xFF;
  data_array[3]=v_rr>>8;
  BLE.setLocalName("MKR1010");
  BLE.setAdvertisedService(HM10_Service);
  HM10_Service.addCharacteristic(heartRate);
  BLE.addService(HM10_Service);
  heartRate.writeValue(data_array,4);
  BLE.advertise();
  while(!host_device) {
    host_device = BLE.central();    // wait for a BLE central
    Serial.println("Bluetooth device active, waiting for connections...");
    }
 Serial.print("Connected to host device: ");
    // print the central's BT address:
 Serial.println(host_device.address());
  // turn on the LED to indicate the connection:
 digitalWrite(LED_BUILTIN, HIGH);
 attachInterrupt(digitalPinToInterrupt(interruptPin), interrupt, RISING);
}
void loop(){
//BLEDevice central = BLE.central();    // wait for a BLE central
  // if a central is connected to the peripheral:
    while(!host_device) {
    previous_time=millis();
     host_device = BLE.central();
     if (host_device) {
       Serial.print("Connected to host: ");
       Serial.println(host_device.address());
      }
    }
    if (host_device.connected()) {
      if (data_arrived) {
    current_time=millis();
    v_rr=current_time-previous_time;
    if (v_rr>1200) v_rr=900 ;
    previous_time=current_time;
    v_bpm=60000.0/v_rr;
    data_array[1]=v_bpm;
    data_array[2]=v_rr;
    data_array[3]=v_rr>>8;
    heartRate.writeValue(data_array,4);
    beep(10,7);
    data_arrived=false;
    }
      }
  else
      {
    // when the central disconnects, turn off the LED:
    digitalWrite(LED_BUILTIN, LOW);
    Serial.println("Connection lost");
    host_device = BLE.central();
    beep(10,7);
    delay(100);
    beep(10,7);
    delay(100);
    beep(10,7);
  }
}

void interrupt()
{
  data_arrived=true;
}
Credits
Related products


Leave your feedback...