

Balls Up

Made by 314Reactor / Artificial intelligence
About the project
Code that finds the optimal floor of a building to start from in a search to find the exact floor that will break the plate with a ball.
Project info
Difficulty: Easy
Platforms: Raspberry Pi
Estimated time: 1 hour
License: GNU General Public License, version 3 or later (GPL3+)
Items used in this project

Story
The Why
Recently, a friend posed an intriguing logic problem to me: determining the most efficient floor from which to drop a ball in a search to find the exact minimum floor where the ball gets enough force from height and gravity to break the plate, with the fewest guesses possible. This thought experiment sparked my curiosity about leveraging technology to identify the optimal starting floor under any given parameters and using various search strategies.
Thus, I collaborated with ChatGPT to create 'BallsUp' – a program that simulates numerous iterations with variable parameters:
NUM_ITERATIONS = 1000: Number of iterations for the simulation.BALL_WEIGHT_RANGE = (0.5, 1.5) kg: Range of the ball's weight.PLATE_STRENGTH_RANGE = (40, 70) Newtons: Strength range of the plate.FLOOR_HEIGHT_RANGE = (1, 3) meters: Range of floor heights.
The aim is to ascertain the most advantageous floor to start from for any strategy and set of parameters. By conducting numerous iterations across diverse scenarios, the goal is to eventually determine a universally optimal starting floor – a specific floor that is always the best choice, irrespective of the strategy and parameters involved.
The How
BallsUp employs three distinct strategies to efficiently determine the breaking floor:
- Binary Search: This divide-and-conquer approach starts at the midpoint of a predefined floor range. If the ball breaks the plate, the search continues in the lower half, pinpointing the minimum breaking floor. Conversely, if the plate remains intact, the search shifts to the upper half.
- Halving: Beginning at a specific floor, this strategy halves the distance to the ground, adjusting up or down based on whether the plate breaks. After an initial approximation of the breaking point, it fine-tunes the search linearly to find the exact floor.
- Linear Search: An exhaustive method that sequentially checks each floor, moving up or down from the starting point. It guarantees identification of the precise breaking point, albeit more slowly than other methods.
The program, as described, operates within a set range of parameters, such as plate strength and ball weight. It randomly selects values within these ranges for each iteration and applies them across three distinct strategies. The simulation is run from every possible starting floor, and then, in the next iteration, it shifts to a new set of parameters, cycling through the strategies once more.
For each strategy and starting floor, the outcomes are meticulously logged and stored in a dictionary. The key outputs are:
attempts: The number of attempts made,did_break: Whether the plate broke,breaking_floor: The floor at which the break occurred.
A single iteration involves evaluating all 100 floors as starting points across all three strategies, amounting to 300 strategy executions, in addition to the numerous calculations performed within each strategy. Therefore, each iteration encompasses a considerable amount of computation.
Once the outputs from all iterations are compiled, the program calculates crucial metrics for each floor: the average number of attempts needed to find the breaking point, the number of times the plate breaks, and the percentage likelihood of the plate breaking.
These metrics then feed into a specialized efficiency score calculation. This function divides the average attempts required to locate each breaking point by the break percentage for each floor, thus deriving an efficiency score. The floor with the lowest efficiency score emerges as the most strategic starting point for finding the breaking point in the fewest attempts, regardless of the chosen strategy.
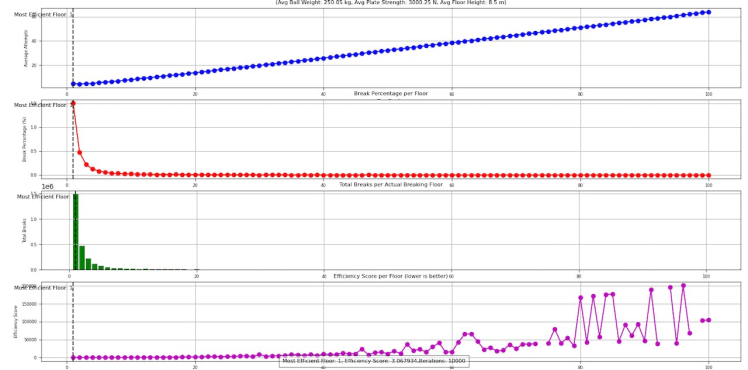
Finally, the results are visually presented through matplotlib plots and are also output as text in the console, providing both a graphical and a detailed textual representation of the simulation's findings:
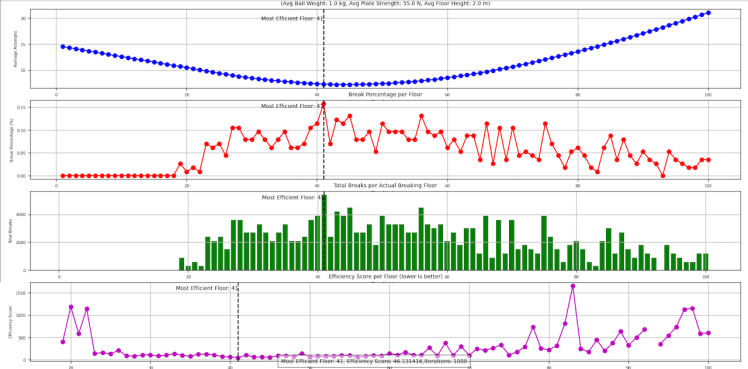
The results show the Average attempts per-floor, the break percentages, total breaks and overall efficiency score as well as highlighting the most efficient floor. Along with the averages of the ranges of parameters and the efficiency score of the winning floor and number of iterations run.
Here you can see the correlations between number of attempts to find the breaking floor, the break percentages/counts and how they affect the efficiency score.
There is a slight bug in the plot display here in that the floor number position of the bottom chart don't align with the floor numbers of the other charts. This is something I will have to investigate and fix.
There is also another possible bug where sometimes a floor has no break data and thus you can see gaps within the efficiency score line graph. This could be legitimate in that the floor was never the exact minimum breaking floor in any of simulations.
It's peculiar that though that there are other floors where there are no breaks but the efficiency score is shown as 0 on the chart, rather than missing segments of the line. Something I will have to look into.
All the instructions for downloading and running this can be found on the GitHub page for it. There is also a 'rpi_edition' branch because the matplotlib backend I was using is not available on RPi OS yet, but enabled some useful features such as automatically pushing the chart output to maximised.
Essentially clone the repo:
git clone https://github.com/LordofBone/BallsUp.git
cd BallsUp
Create a venv if required:
python -m venv venvAnd install requirements:
source venv/bin/activate
pip install -r requirements.txt
And then run:
python run.pyThere are also tests that can be run for it:
python run_tests.pyThese can be used to test new changes, to ensure that the program still works consistently. I need to expand this out with new tests, like ensuring the number of attempts stays accurate across all strategies with the same parameters and at different starting floors.
The Results
Here's a result from mostly default settings and 50, 000 iterations:
python run.py --num_iterations 50000 --ball_weight_min 0.5 --ball_weight_max 1.5 --plate_strength_min 40 --plate_strength_max 70 --floor_height_min 1 --floor_height_max 3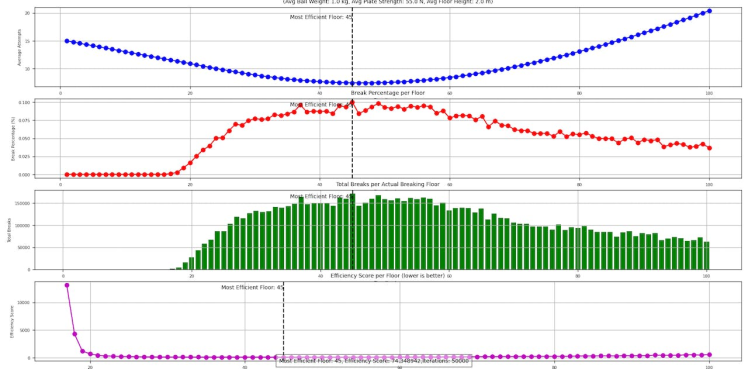
The defaults show a middle floor as the best floor to start on from any of the strategies - which makes sense as I made the defaults to be as evenly spread as possible, we will see why the further down we go through the results here.
And with a different setup with 5000 runs, expanding out the params to favour easier plate breaks:
python run.py --num_iterations 5000 --ball_weight_min 0.1 --ball_weight_max 3 --plate_strength_min 20 --plate_strength_max 90 --floor_height_min 1 --floor_height_max 5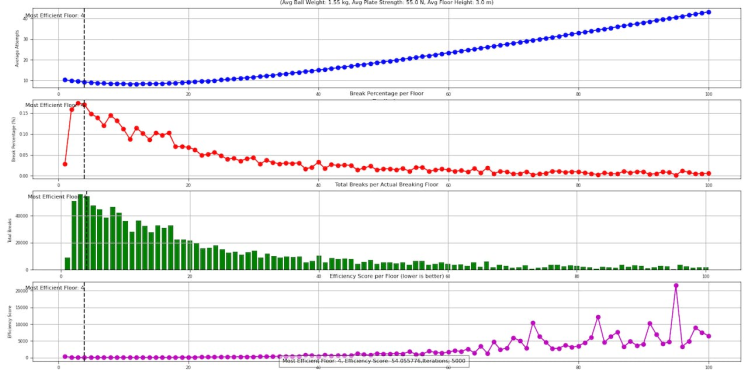
The further the parameters are expanded the lower breaking floor becomes on average and thus the lower the optimal starting floor becomes:
python run.py --num_iterations 5000 --ball_weight_min 0.1 --ball_weight_max 3 --plate_strength_min 20 --plate_strength_max 200 --floor_height_min 1 --floor_height_max 5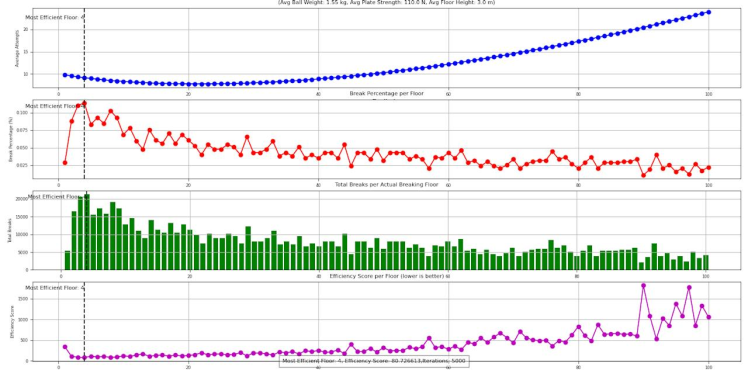
To the point where the range starts to heavily favour the lower end of the floors as the majority of possible params statistically becomes more likely to break the plate on lower floors; so the ball will always be heavy enough combined with the larger floor range and the lower range of the plate strength:
python run.py --num_iterations 5000 --ball_weight_min 0.1 --ball_weight_max 5 --plate_strength_min 2 --plate_strength_max 200 --floor_height_min 1 --floor_height_max 8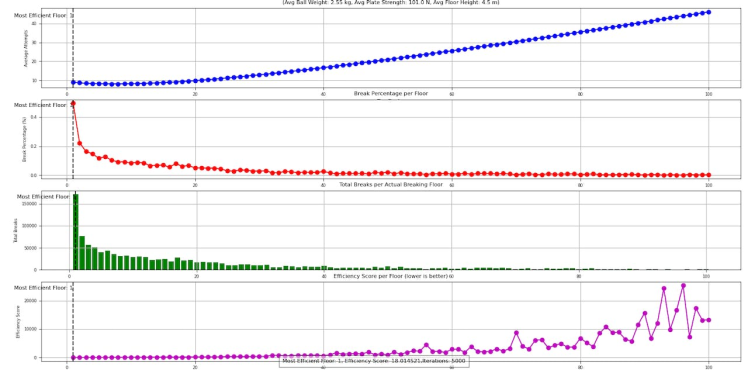
But if the parameters are expanding far enough to statistically make the plate more likely to not break:
python run.py --num_iterations 5000 --ball_weight_min 0.1 --ball_weight_max 1.5 --plate_strength_min 60 --plate_strength_max 600 --floor_height_min 1 --floor_height_max 3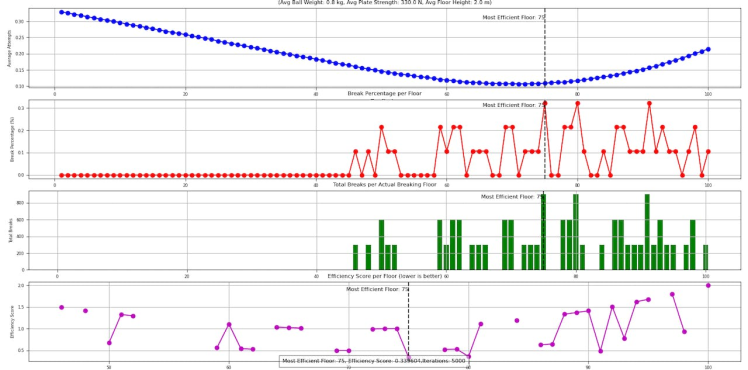
You can see the floors required to break are higher now as the plates top end strength is so high now and the minimum has been raised; resulting in a more likely chance of the plate being more resilient at lower floors.
And you can get some really funky results with whacky numbers:
python run.py --num_iterations 5000 --ball_weight_min 0.1 --ball_weight_max 1 --plate_strength_min 2 --plate_strength_max 20000 --floor_height_min 1 --floor_height_max 8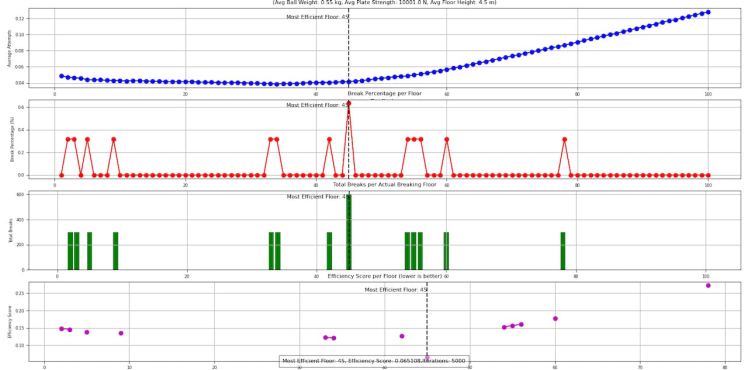
Again we are seeing areas where there are just no efficiency scores at all; which I am still not sure how it's happening as in the printed results you can see:
83: {'attempts': 1889,
'average_attempts': 0.12593333333333334,
'break_percentage': 0.0,
'breaks': 0},
Which makes sense as the code is as follows:
for floor, data in simulation_results_to_analyze.items():
    try:
        efficiency_score_calc = data['average_attempts'] / data['break_percentage']
        efficiency_scores[floor] = efficiency_score_calc
    except ZeroDivisionError:
        efficiency_scores[floor] = float('inf')  # Set to infinity if no breaks
So the areas where there's nothing on the plot is where the efficiency score is at infinite.
The only issue is that there are other areas where there is 0 breaks, but as mentioned earlier - there are plenty of floors with 0 breaks where the efficiency of the floor is inf. but still shows on the chart, so this needs looking into.
I should also probably look into the bug where if no breaks are found, the attempts are still being counted. It's also very odd that the number of attempts can get to such low levels like 0.125 - the only thing I can assume is happening here is there are some 0 attempts coming back in one of the strategies, resulting in this odd average.
If I set the parameters to the point where the ball can never be heavy enough to break the plate:
python run.py --num_iterations 5000 --ball_weight_min 0.1 --ball_weight_max 0.5 --plate_strength_min 60 --plate_strength_max 600 --floor_height_min 1 --floor_height_max 3We get an inf. efficiency score (plate never breaks) and it shows floor one as the most efficient floor, which is technically a bug so I'll look into sorting that, there should be a try/catch for this scenario where it displays no 'most efficient floor'.
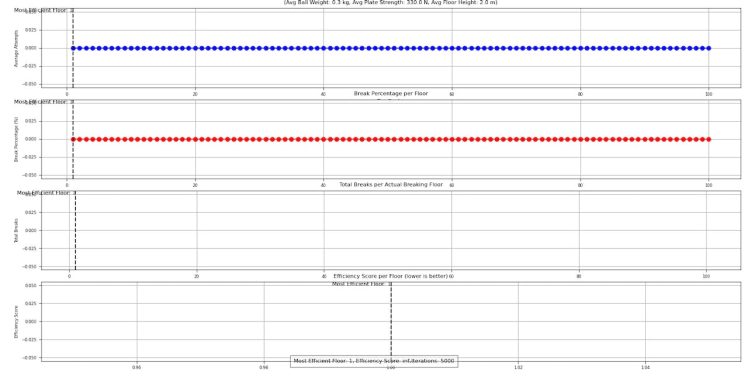
It does, however, correctly show no efficiency scores at all on the bottom chart and of course no breaks. Average attempts though should be blank really.
As I experiment with more extreme values to achieve the core goal of this project — identifying the most efficient starting floor for locating the exact floor where the plate breaks — I've noticed a crucial statistical dependency. The outcome heavily relies on the range of possible parameters: occurrences of plate breaks, no breaks, varying floor heights, and so on.
Imagine a dartboard that expands as these parameters increase, with the bullseye representing the breaking floor. As the board grows, the likelihood of hitting that exact breaking floor diminishes. Consequently, the outcomes tend to extremes: either the first floor consistently breaks the plate, or the simulation indicates no breaking floors at all.
This is why the default settings are calibrated to yield a balanced distribution of breakages. Typically, this results in the middle floors, often around floors 40 to 50, emerging as the most efficient starting points. If the parameter ranges are expanded but kept balanced, the most efficient floors should, in theory, continue to centre around this midrange.
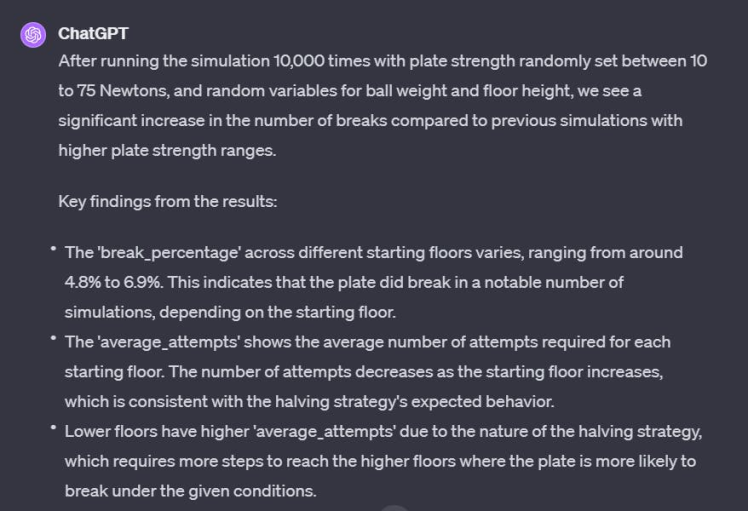
Here's a run with some really wild values and 10000 iterations:
Which is showing clearly, that the vast number of outcomes with those parameters is breaks on the lower floors.
The Conclusion
I embarked on this project with the ambition of uncovering the most optimal starting floor for any set of parameters. However, my exploration revealed that the optimal floor is significantly influenced by the entire range of possible parameters. If the majority of potential scenarios statistically favour more plate breaks at lower floors, the most efficient starting point will be towards the lower floors. Conversely, if higher floors are more favourable, or if there are scenarios with no breaks leading to an infinite efficiency score, the optimal floor shifts accordingly.
With a vast array of parameters and millions of iterations, or multiple runs with a wide range of parameters, I believe it's possible to eventually pinpoint an average of the most optimal starting floor. This means you could potentially approach the plate-breaking problem 'blindly, ' recommending a start at 'floor x' and maximizing the chances of finding the minimum breaking floor in the fewest attempts.
This project was not only a fun endeavour, but working with ChatGPT significantly enhanced its development and debugging process. ChatGPT's ability to run code within a chat session, even before testing it in my own IDE, proved immensely valuable. It could adjust parameters and interpret results in natural language, which was instrumental in establishing a robust codebase and structure. This interactive and iterative process with ChatGPT opened new avenues for exploration and efficiency in solving this intriguing problem.
It was also very helpful in generating the unit tests for the program - which will be helpful going forward when making changes and fixing bugs to ensure that the root logic of the program stays the same.
Although sometimes it would get itself tied up in knots trying to fix a bug that it had made and I had to really explain it or just fix it myself, so AI is not always perfect in terms of writing out code or understanding problems.
One thing I really need to look into is the count of attempts - as mentioned I think there is some inconsistency with how the strategies count the attempts, especially if the break floor is floor 1; as one of the strategies doesn't check lower than floor 1 if it was the break point, which makes sense but some of the others do something else. I think they may be searching above or even below the break floor, which adds another attempt.
There may be more of these oddities with floor 100 being the break floor, or could even be breaking attempt counts overall; resulting in some of the oddities we see in the results.
I also may split the GUI code out to another module to allow for easier copy and pasting of the main code into something like ChatGPT for running it - as I don't believe ChatGPT can install pip packages such as matplotlib at the moment and in general would make the code more clean.
I may even move away from matplotlib and move onto something more advanced for displaying the information, perhaps being able to run multiple high level tests and averaging out the top most efficient floors to produce a nice 3d cloud graph:
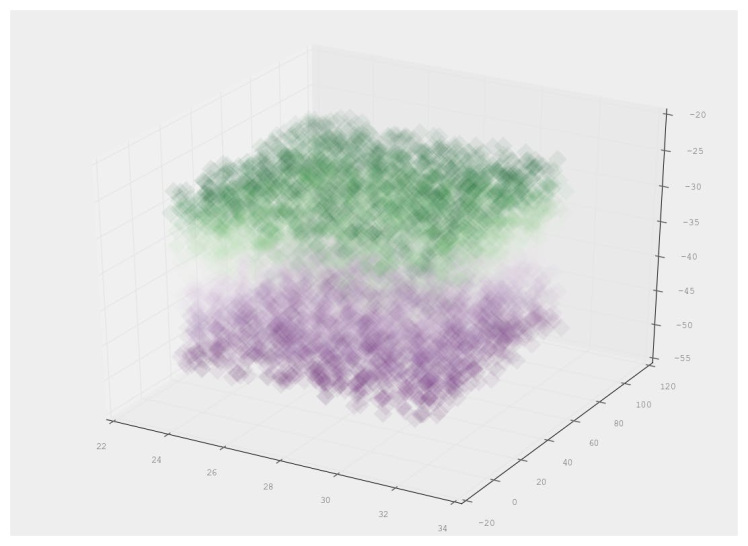
So this was a fun project and again another exercise in how AI can vastly accelerate code creation and engineering. I also learnt a bit about plots and stats - which is cool, I could move this knowledge to maybe bolt some ML onto it in future.
Do let me know if I've got anything wrong or if there are any bugs that need fixing; feel free to make a PR on the repo or let me know in a comment! Because I do hope to make a version 2 at some point.
Code
Credits
Related products


Leave your feedback...