





Arduino Uno R4 Smart Grid Monitor

Made by electroscope_archive / IoT
About the project
Track voltage, current, power, and energy in real time with Arduino UNO R4 WiFi and ThingSpeak.
Project info
Items used in this project
Hardware components




Story
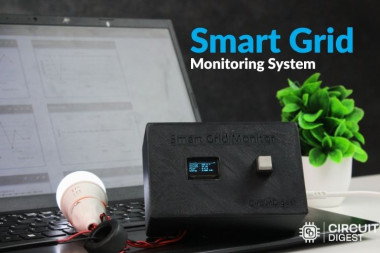
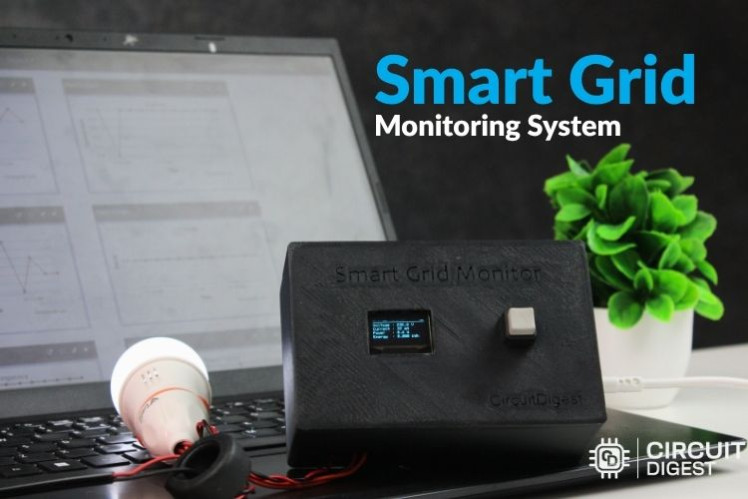
As electricity costs continue to rise, understanding how your devices consume power has become more important than ever. This IoT project demonstrates how to build a practical IoT-based smart grid monitor using the Arduino UNO R4 WiFi and the PZEM-004T energy meter.
The system measures voltage, current, active power, energy consumption, frequency, and power factor. These values are displayed locally on a compact OLED screen and uploaded to ThingSpeak for cloud-based visualization and historical analysis.
Whether you are a student, hobbyist, or engineer, this project offers a hands-on introduction to energy monitoring, Modbus communication, and IoT dashboards.
Why Build a Smart Grid Monitor?
A smart grid is an electrical system that continuously monitors power usage and shares the data over a network. Instead of checking your utility bill at the end of the month, you can view live measurements and identify inefficiencies as they happen.
This project helps you:
- Monitor real-time power consumption
- Detect abnormal voltage or current
- Analyze appliance efficiency
- Log energy usage over time
- Access data remotely from anywhere
It is useful for home energy audits, laboratory experiments, and industrial monitoring prototypes.
How the System Works
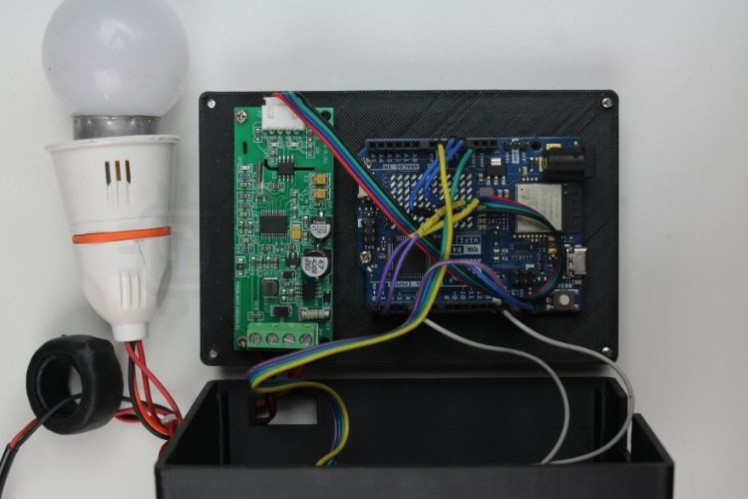
The PZEM-004T measures the electrical parameters from an AC line using an internal voltage sensing circuit and an external current transformer.
The Arduino UNO R4 WiFi reads the data over Modbus RTU using its hardware serial port. The board then:
- Processes the measurements
- Displays them on a 128×64 OLED
- Connects to Wi-Fi
- Uploads the values to ThingSpeak
This creates a complete edge-to-cloud monitoring system.
Parameters Measured
The system monitors six key electrical values:
- Voltage (V)
- Current (A)
- Active Power (W)
- Energy (kWh)
- Frequency (Hz)
- Power Factor
These parameters provide a clear picture of how efficiently a load is operating.
Components Required
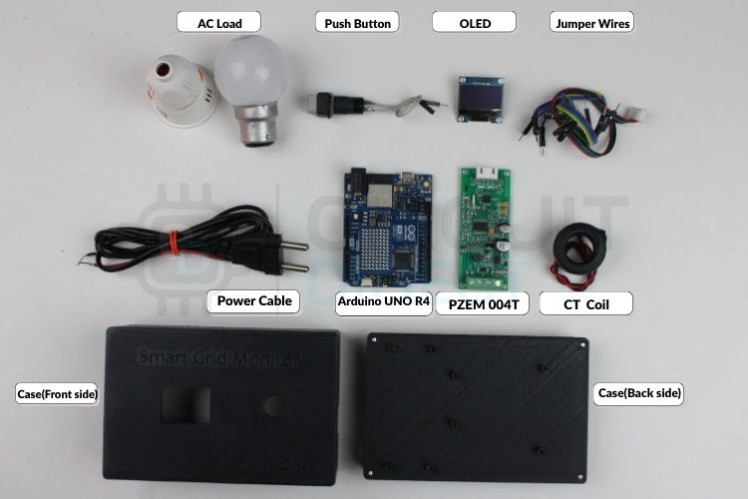
To build this project, you will need:
- Arduino UNO R4 WiFi
- PZEM-004T V3.0 energy meter
- Current transformer clamp (included with the PZEM module)
- 0.96-inch I2C OLED display
- Push button (optional)
- Jumper wires
- Breadboard or custom PCB
- USB cable
- AC load for testing
Why Use Arduino UNO R4 WiFi?
The UNO R4 WiFi is an excellent choice because it combines the familiar Arduino form factor with built-in wireless connectivity.
Key advantages include:
- 32-bit Renesas RA4M1 microcontroller
- Built-in ESP32-S3 for Wi-Fi and Bluetooth
- Hardware UART for reliable Modbus communication
- Higher processing speed than the UNO R3
- Native 5 V logic compatibility
This makes it ideal for IoT and industrial monitoring applications.
Understanding the PZEM-004T
The PZEM-004T is a ready-to-use AC energy monitoring module that handles all signal processing internally.
It provides
- RMS voltage and current measurement
- Real power calculation
- Energy accumulation
- Frequency measurement
- Power factor calculation
The module communicates digitally via Modbus RTU, so no analog calibration is required in your code.
Wiring Overview
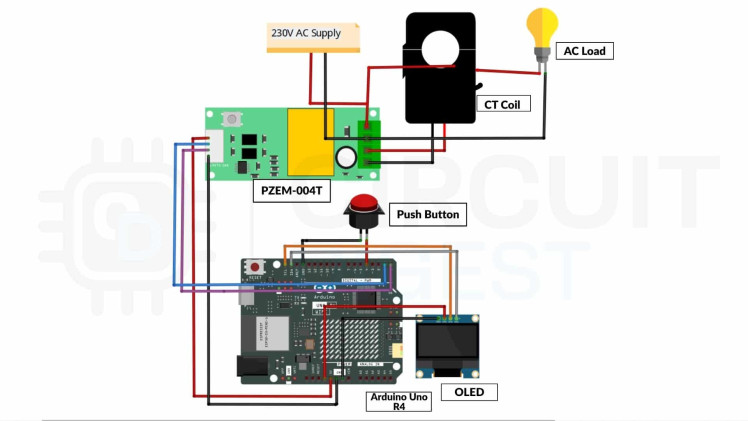
PZEM-004T to Arduino UNO R4 WiFi
- TX → RX1 (Pin 0)
- RX → TX1 (Pin 1)
- VCC → 5 V
- GND → GND
OLED Display
- SDA → SDA
- SCL → SCL
- VCC → 5 V
- GND → GND
Push Button (Optional)
- One terminal → D7
- Other terminal → GND
The button can be used to switch between display screens.
Safety Note
This project interfaces with mains AC voltage.
Always follow these precautions:
- Disconnect power before wiring
- Use insulated enclosures
- Clamp the CT around only one conductor
- Never touch exposed AC terminals
- Test with a low-power load first
If you are not experienced with mains electricity, seek guidance from a qualified professional.
Software Libraries
Install the following libraries through the Arduino IDE Library Manager:
- PZEM004Tv40
- Adafruit SSD1306
- Adafruit GFX
- ThingSpeak
- WiFiS3
These libraries simplify communication with the energy meter, OLED display, and cloud platform.
Setting Up ThingSpeak
Create a free account at ThingSpeak.
Create a new channel with six fields:
- Voltage
- Current
- Power
- Energy
- Frequency
- Power Factor
Copy the Channel ID and Write API Key into your Arduino sketch.
Firmware Workflow
The program follows a simple loop:
- Read all values from the PZEM-004T
- Update the OLED display
- Connect to Wi-Fi if needed
- Upload the data to ThingSpeak
- Repeat every few seconds
This structure keeps the code modular and easy to maintain.
Example Code Snippet
if (pzem.readAll()) {
  voltage = pzem.getVoltage();
  current = pzem.getCurrent();
  power = pzem.getPower();
  energy = pzem.getEnergy();
  frequency = pzem.getFrequency();
  pf = pzem.getPF();
}
With one function call, all six electrical parameters are updated.
Cloud Dashboard
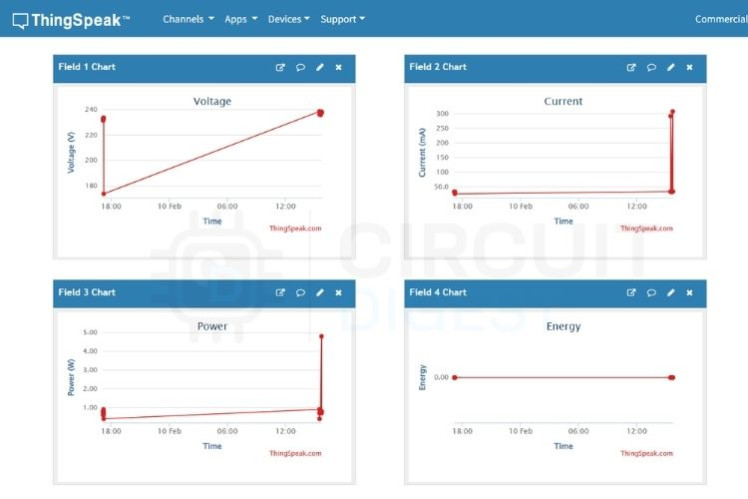
Once the data is uploaded, ThingSpeak automatically generates charts for each field.
These graphs allow you to:
- Track daily energy consumption
- Compare appliance behaviour
- Spot voltage dips and current spikes
- Analyze long-term trends
The dashboard can be viewed from any browser or smartphone.
OLED Display Output
The OLED provides instant local feedback without requiring internet access.
Typical screens display:
- Voltage and Current
- Power and Energy
- Frequency and Power Factor
This makes the project useful even when Wi-Fi is unavailable.
Testing the System
During testing, the monitor was connected to common household loads such as lamps and fans.
The readings were stable and closely matched expected values. Cloud graphs clearly showed startup current surges and changing power demand as devices were switched on and off. Similar experiences are echoed by Arduino makers who have built comparable systems using the same hardware.
Enclosure Design
For a cleaner and safer installation, the electronics can be mounted inside a custom 3D-printed enclosure.
A well-designed enclosure should include:
- OLED window
- Button opening
- Ventilation slots
- Cable routing holes
- Insulated AC section
This gives the project a polished, professional finish.
Applications
This smart grid monitor can be used for:
- Home energy monitoring
- Solar system analysis
- Appliance testing
- Preventive maintenance
- Educational demonstrations
- Industrial prototyping
Possible Upgrades
You can expand the project by adding:
- Relay control for load switching
- SMS or email alerts
- Blynk or MQTT integration
- SD card logging
- Multiple energy meters
- Mobile app dashboard
Final Thoughts
This Smart Grid in IoT project is an excellent introduction to smart energy monitoring and IoT. By combining the Arduino UNO R4 WiFi with the PZEM-004T, you can build a reliable system that measures electrical performance, displays live data, and stores everything in the cloud.
It is simple enough for beginners yet powerful enough for real-world applications. If you want to learn about power measurement, Modbus communication, and cloud dashboards in one practical build, this is a rewarding project to try. Explore 1000+ Arduino Projects with step-by-step tutorials, circuit diagrams, and source code for DIY electronics, IoT, robotics, and home automation ideas for beginners and engineers.
Schematics, diagrams and documents
Code
Credits
Related products





Leave your feedback...