
With eyes on the edge: A Desktop Robot Based on TinyML
Made by electrouser865
About the project
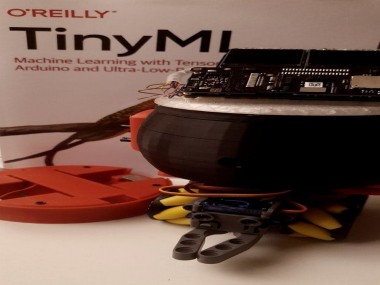
A desktop robot for human health care, Tha uses the ML model to recognize emotion, hand gesture and atrial fibrillation.
Project info
Items used in this project
Hardware components

Software apps and online services
|
|
Multitool, Screwdriver | |
|
|
TinyML | |
|
|
solidworks | |
|
|
Keras | |
|
|
TensorFlow | |
|
|
Python3 | |
|
|
OpenMV | |
|
|
Arduino IDE |
View all
Story
Edge computing is a type of computing, where the devices are located in the same physical location as the user. This allows users to get faster and more reliable services, and enterprises can take advantage of the flexibility of hybrid cloud computing. With edge computing, users can use and distribute a common set of resources across a large number of locations. This brings a number of advantages for those using it, as faster and more stable services can be obtained at a lower cost.
This is reflected in the users as they get a faster and more uniform experience. At the same time, this closeness of the computer systems translates into low latency and high availability applications with permanent monitoring.
Many of the applications for robotics based on edge computing technology are directly related to the industry. Since, mainly, industrial robots need to perform different tasks with time constraints and cannot afford latency when receiving the next command to execute a welding task, manipulating an object or classifying objects using machine vision, etc.
In recent years, we have been able to observe different applications of edge computing applied to assistive robotics. These robots incorporate powerful computing units, capable of executing tasks such as artificial vision, machine learning, navigation, etc. Assistive robots such as Softbank's Paper (Figure 1) are one of the examples of this type of robot.
Figure 1: Robot pepper Soft Bank

Figure 1: Robot pepper Soft Bank
One of the disadvantages of these robots, however, is their price, which makes them not very accessible to people. However, with the advent of new, smaller, cheaper, and more powerful devices, it has been possible to adopt a new type of low-cost assistive robot. These robots are capable of running object recognition models, analyzing signals, recognizing people, etc.
These robots use Edge computing technology and low-cost Edge AI, this has made that these robots can be smaller, but with high computational power.
With eyes on the edge: An Approach to Desktop Robots
One of the most interesting applications in which EDGE-AI can be applied is in robotics. We naturally think of robots as large machines with powerful processing units that see, hear and interact with the world. However, there is a new range of small, portable robots that are used as companion robots. These companion robots stand out for their simplicity, medium computing power, in some cases integrated ARM microprocessors that support Linux, etc. These robots do not have locomotion capabilities such as wheels or legs, this is mainly because they are designed to be static and located on desks or to be carried with the user (Figure 2).
Figure 2: OpenVino and Neural Stick 2 in a Companion Robot.

Figure 2: OpenVino and Neural Stick 2 in a Companion Robot.
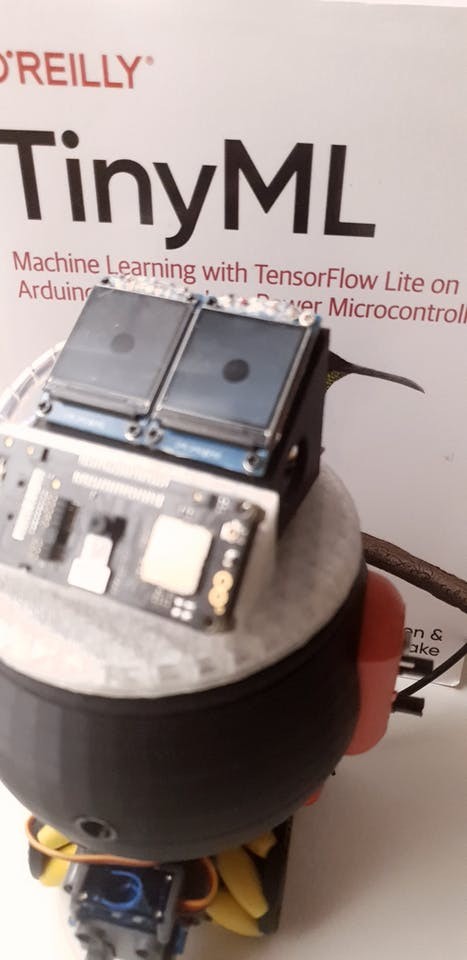
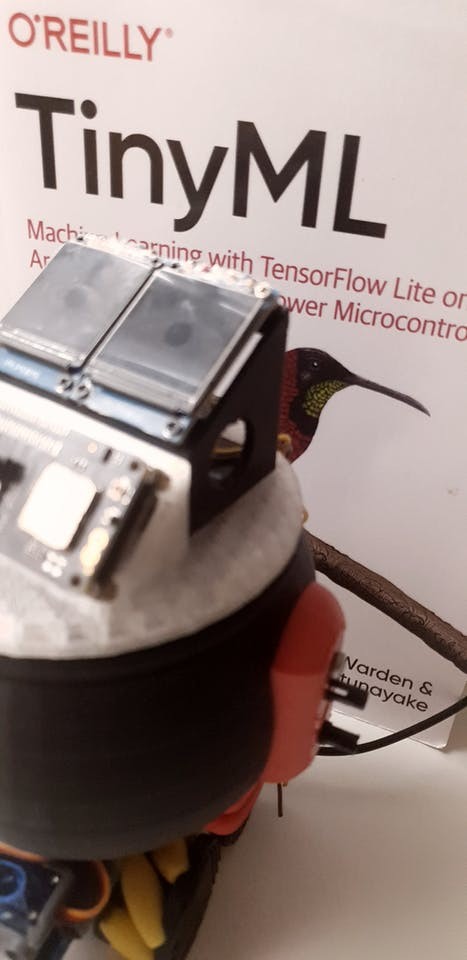
Following these guidelines, the robot (Figure 3) is a desktop companion robot. It was designed for the on-site surveillance of elderly people, workers, children, etc. To perform this task, the robot has a series of sensors and machine learning models that allow it to classify emotional states, manual gestures to interact with it, environmental sensors, and a modular locomotion system with omnidirectional wheels that allow it to move around the environment.
Figure 3: Robot Prototype

Figure 3: Robot Prototype
In the case that the robot is in charge of monitoring elderly people with cardiac problems, the robot has the possibility to communicate with a device that captures ECG signals. This system sends the information to the robot using a LoRa prototype, which sends the ECG signal to the robot for analysis. This analysis makes it possible to determine whether the user may have atrial fibrillation.
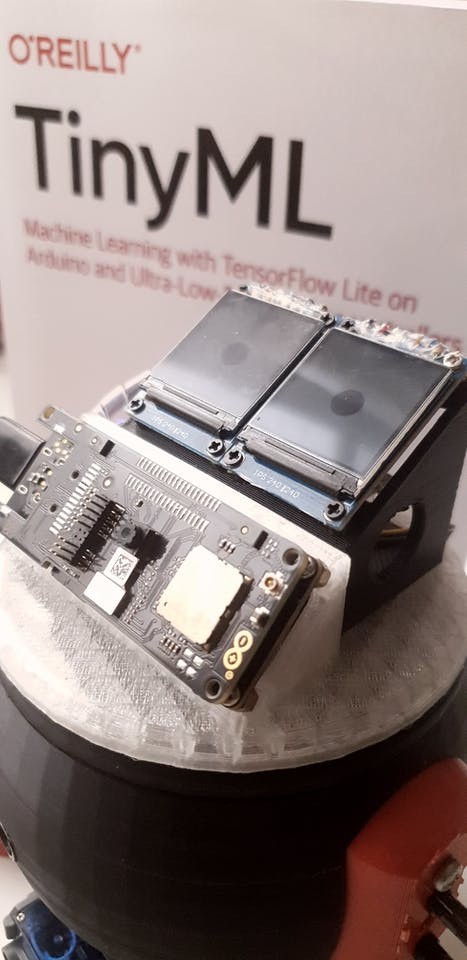
The robot is divided into three parts, the first one is the body of the robot, in which the sensors, control, and processing units are located. As well as, screens that allow the eyes to be displayed, giving the robot a friendly appearance that facilitates integration with humans.
The second part of the robot is a mobile platform, this gives the robot the ability to move around the desk, table, or any surface. Finally its charging base, its charging base is used to charge the batteries of the robot and/or to have the robot in a fixed place. Next, we will describe in detail each of the parts that make up the robot.
Body Robot
The robot body was built using 1.75 mm PLA, the robot is compatible with LEGO parts. This allows it to be upgraded by the user.
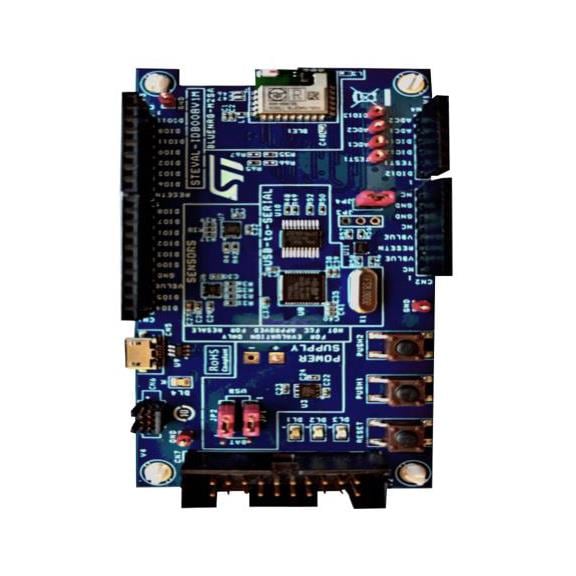
The control and processing elements of the robot are based on the Arduino Pro Portenta H7 (Figure 4), Vision shield (Figure 5),
Figure 4: Portenta H7

Figure 4: Portenta H7
Figure 5: Portenta H7 LoRa Wan Vision Shield

Figure 5: Portenta H7 LoRa Wan Vision Shield
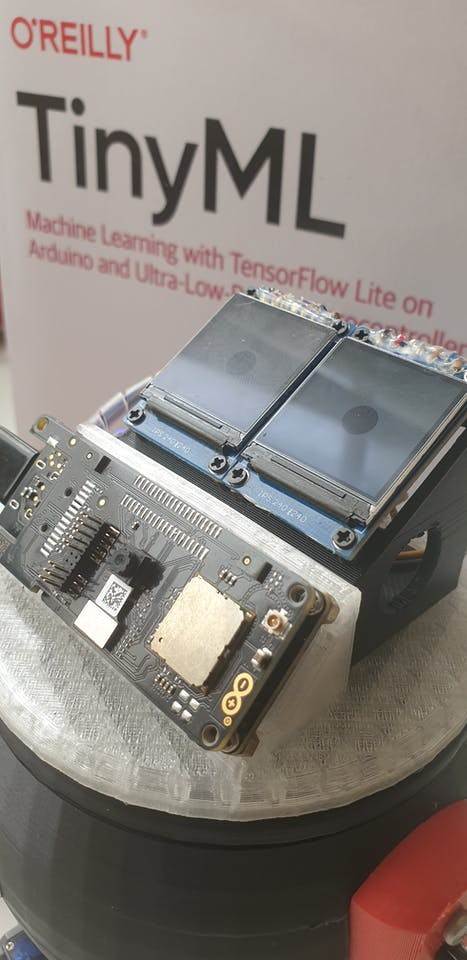
two LCD screens (Figure 6) with SPI input data interface, ST7789VW IC control chip, resolution of 240RGB * 240 dots.
Figure 6: LCD

Figure 6: LCD
An Arduino Mini is responsible of controlling the two LCD screens, which are used to display the robot's eyes. Since the goal of this robot is to monitor the environment, two environmental sensors have been added. The first sensor is a gp2y1010au0f dust sensor (Figure 7) that measures the amount of dust in the environment.
Figure 7: Dust Sensor

Figure 7: Dust Sensor
This sensor is located on the inside of the robot (Figure 8).
Figure 8: Dust Sensor in side the robot.

Figure 8: Dust Sensor in side the robot.
Another important parameter to measure is air quality through the CCS811 sensor (Figure 9), which is a low-power digital gas sensor solution. It allows integrating a gas sensor for detection of low levels of VOCs typically found indoors, with a microcontroller unit (MCU) and an analog-to-digital converter to monitor the local environment and provide an indication of indoor air quality through an equivalent CO2 or TVOC output via a standard I2C digital interface.
Figure 9: Digital gas sensor

Figure 9: Digital gas sensor
This sensor is located at the front of the robot's head (Figure 10).
Figure 10: Monitoring indoor air quality in side the Robot.

Figure 10: Monitoring indoor air quality in side the Robot.
To make the connection with the CCS811 sensor it was necessary to modify the library made by Notthemarsian so that the Portenta H7 could access this sensor.
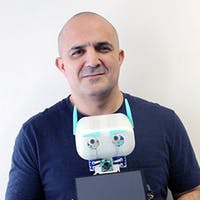
However, this was not the only library that was modified, at the beginning of the project the Portenta H7 Bluetooth communication in micropython did not exist. So it was necessary to make some modifications to the micropython bluetooth library and thus give the robot the ability to connect via Bluetooth. This connection is important because this is how the robot can control the Rover.
Rover
As mentioned above, the robot has a mobile platform that allows it to move on any surface. This platform is coupled to the robot body using two neodymium magnets, which allows the robot body to move or be controlled by the user. This mobile platform was built using the M5Stack Rover Pro (Figure 11).
Figure 11: Rover Supported Movement.

Figure 11: Rover Supported Movement.
This mobile platform has four omnidirectional wheels that allow the robot to move in any direction (Figure 12), while at the same time it has a gripper that allows it to pick up small objects and move them from one place to another.
Figure 13: Rover Supported Movement.

Figure 13: Rover Supported Movement.
Software Description
In this section, we will describe the different software tools used for training machine learning models.
This mobile platform has four omnidirectional wheels that allow the robot to move in any direction (Figure ref{fig:m5rover_mov}), while at the same time it has a gripper that allows it to pick up small objects and move them from one place to another.
Perhaps one of the most important aspects of robots is how they interact with humans. There are different ways to achieve this interaction, speech recognition, remote control systems, image processing, among others.
In some cases, all these interaction methods require large processing units (I say large if we compare them with the Portenta H7) as NVIDIA Jetson board, Raspberry Pi 4, mini-computers with Linux-based operating system, etc.
The use of these devices is directly related to the application to be performed, however, with these new processors capable of running classification models it is possible to perform infinite applications.
Hand Gesture Detection
In order to allow the user to interact with the robot in a non-verbal way, it was decided to incorporate the identification of manual gestures. These gestures allow the user to move the rover in different directions.
The robot is able to recognize seven hand gestures as shown in Figure 14, allowing the robot to activate, move backward, forwards, left, right, or not move at all.
Figure 14: Hand Gesture.

Figure 14: Hand Gesture.
To perform this classification, 100 images were captured for each of the seven classes, in total 700 images were obtained which were divided into three. Eighty percent were used for training, ten percent for testing, and the remaining ten percent for validation. The images were acquired using the OpenMV platform, accessed through Tools --> Dataset Editor --> New Dataset (Figure 15).
Figure 15: Create Datasert using OpnMV.

Figure 15: Create Datasert using OpnMV.
For the training we used a MobileNetV1 network, the images were preprocessed and resized to be compatible with the network architecture. At the end, the images had a size of 128x128. The hyperparameters used to perform the training:
- alpha=0.5
- dropout_rate=0.01
- depth_multiplier=1.0
- pooling=avg
- weights=imagenet
- dropout_rate=0.001
The number of epochs was 60, since it was observed that if more than this value was used, the network suffered from overtraining.
Table 1 shows the classification scores obtained for the detection of hand gestures, an accuracy of 97% was obtained.
Table 1

Table 1
Figure 16 shows the normalized confounding matrix obtained with the trained model, as can be seen, the diagonal of the matrix is 1.0 except for the class Front which is 0.82.
Figure 16: Normalised confusion matrix of hand gesture detection.

Figure 16: Normalised confusion matrix of hand gesture detection.
The missing 0.18 to be one is in the class Left, this is mainly due to the fact that the two classes are very similar and the model gets confused (Figure 17).
Figure 17: Flront and Left Class.

Figure 17: Flront and Left Class.
Emotion Classification
Emotions are psychophysiological reactions that represent ways of adaptation to certain stimuli of the individual when perceiving an object, a person, a place, an event or an important memory. They are what we feel when we perceive something or someone. They are universal and common to all cultures.
Emotions.

Emotions.
The classification of emotions became an important aspect to investigate and even more important was to be able to classify them correctly. To do this there are different techniques and tools that help in this classification. It is possible to use bio-signals to perform this classification, signals such as skin resistance (GSR), Electrocardiography (ECG), and electroencephalography (EEG) are perhaps the most common and most reliable signals. However, one of the problems is their high level of intrusiveness to the user, other techniques such as the use of an image are somewhat more common. However, this technique is also unreliable because the person may be sad, but show a happy face.
Due to the ease of classifying emotions using image processing, this desktop robot integrates a model that classifies eight emotional states: afraid, angry, disgusted, happy, neutral, sad, surprised, and bored.
To train the network, a MobileNetV1 network was used, the images were preprocessed and modified in dimension to be compatible with the network architecture. In the end, the images had a size of 128x128.
To perform the training of the network, a database was used which was divided into three parts. An 80% was dedicated to the training of the model, 10% to the test, and the remaining 10% to the validation. The results obtained during the training process are shown below. Figure 18 shows the accuracy obtained during the model validation process, this accuracy is around 95% correct.
Figure 18: Accuracy Emotion Classification.

Figure 18: Accuracy Emotion Classification.
Table 2 shows the different scores obtained in the validation of the model.
Table 2

Table 2
Figure 19 shows the normalized confusion matrix, it can be observed that the diagonal has high values, which gives us to understand that the system learned the emotions correctly.
Figure 19: Normalised confusion matrix of emotion classification.

Figure 19: Normalised confusion matrix of emotion classification.
Atrial Fibrillation Detection
Cardiovascular diseases (CVD), such as hypertension, ischemic heart disease or arrhythmias, are currently the leading cause of death in the world.
arrhythmias, are currently the leading cause of death in the world cite{joseph2017reducing}.
ECG signal monitoring is a major concern in cardiovascular healthcare. In fact, many CVDs can be better diagnosed, controlled, and prevented by continuous monitoring systems. New technologies are currently being integrated into the development of ECG monitoring systems to provide efficient, cost-effective, fully connected, and power systems. In this section we present the most relevant and related work addressing the same domain or characteristics, highlighting their contributions to the state of the art.
Cardiac arrhythmias are one of the most commonly treated diseases by clinical cardiologists. Atrial fibrillation (AF) is the most common heart rhythm disorder among the population and its incidence and prevalence are progressively increasing worldwide, especially in developed countries [1]. For example, in European countries [2], it is estimated that between 1% and 3% of the adult population is diagnosed with AF, exceeding 15% in people aged 80 years or older. Whereas normal sinus rhythm manifests as a single electrically activated wavefront propagating from the atria to the ventricles, AF is characterized by the presence of multiple wandering wavefronts with different propagation patterns that may be asymptomatic or cause symptoms such as palpitations, dyspnea, and dizziness. Therefore, the robot incorporates a model that will allow it to classify ECG signal classification:
- Nr - Normal sinus rhythm
- Af - Atrial fibrillation
- O - Other rhythm
- No - Too noisy to classify
In order for the robot to perform this classification, it is necessary for the user to have an ECG capture device.
The ECG is a test that is often performed to detect cardiac problems in order to monitor the condition of the heart. It is a representation of the electrical activity of the heart recorded from electrodes placed on the surface of the body. The standard ECG consists of the recording of 12 leads of the heart's electrical potentials: Lead I, Lead II, Lead III, aVR, aVL, aVF, V1, V2, V3, V4, V5, V6 (Figure 20).
Figure 20: Placement of 6 chest leads.

Figure 20: Placement of 6 chest leads.
The 12-lead ECG provides spatial information about the electrical activity of the heart in 3 approximately orthogonal directions:
- Right - Left
- Upper - Lower
- Front - Rear
The disadvantage of the ECG is the complexity of the installation of all the electrodes and the equipment necessary for signal acquisition.
In our case, we will only focus on the electrodes that capture leads I, II, and III. To perform the acquisition of these signals, we only need three electrodes located at the extremities, as shown in Figure 21.
Figure 21: Three Leads ECG.

Figure 21: Three Leads ECG.
To achieve this classification, a correctly labeled signal dataset is required. The dataset used for this project was used in a cardiology challenge in 2017 on the Physionet website. There are different ways to approach this classification problem, in my case I have chosen to convert each of the signals present in the database into an image (Figure 22).
Figure 22: Axis-free ECG signal.

Figure 22: Axis-free ECG signal.
This process resembles the methodology that a physician uses when reading an ECG, he does not analyze the signal by performing possible frequency transformations and using advanced signal processing techniques. In his case, the physician uses the ECG signal printouts and analyzes the signal, based on his academic training. In this way, he can determine if the distance between R peaks is too high or too low or if any of the other waves are abnormal (Figure 23).
Figure 23: Heart Signal and its waves.

Figure 23: Heart Signal and its waves.
During the realization of this project, I tried different ways to use the signal (which in my opinion is the best option), but I tried to get the computer to read a sequential network but I did not get any results.
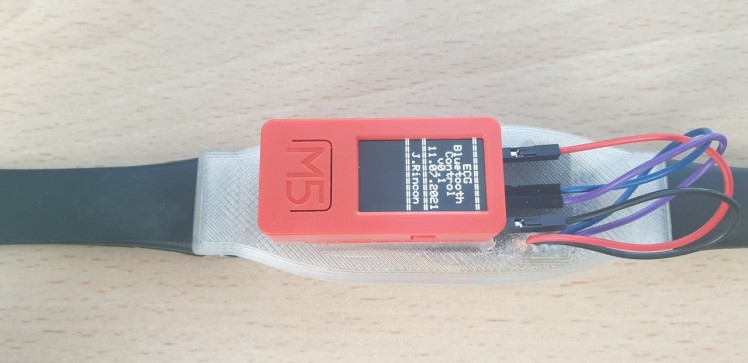
In order to transmit the ECG signal, several devices were considered for this task and the decision was made to use the NeuroSky BMD-101 Cardio-Chip (Figure 24).
Figure 24: BMD-101 Cardio Chip

Figure 24: BMD-101 Cardio Chip
To interface with the BDM-101 we used an M5StickC-Plus, which communicates with the Cardio-Chip through serial communication. For more information about of the communication protocol, please refer to this link.
1 / 6
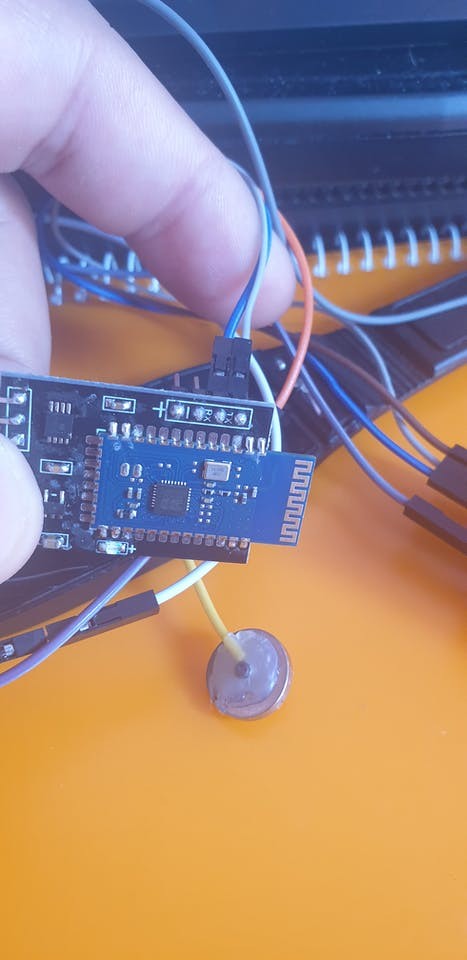

Figure 25: BMD-101 and M5StickC-Plus

Figure 25: Chest Strap
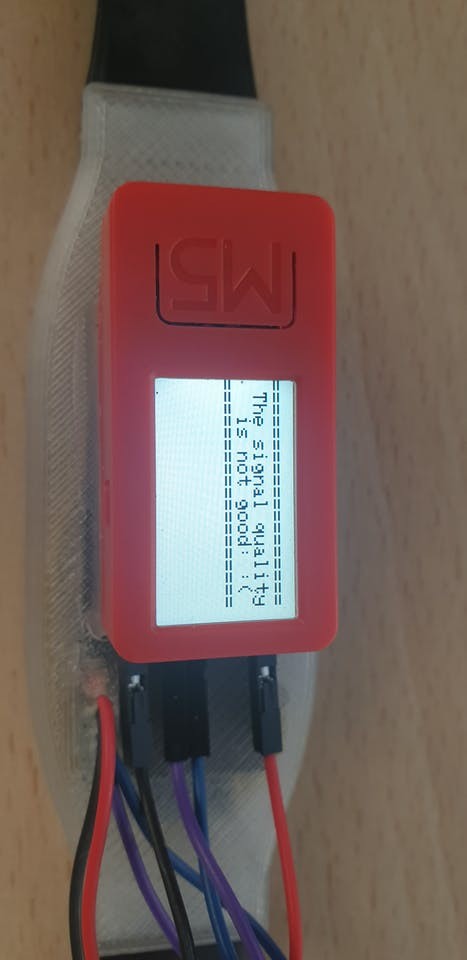
The M5StickC-Plus sends the data to the Portenta H7 using Bluetooth communication, it is important to note that the ECG signal should not be graphed. This slows down the data sending time and the signal reconstruction on the Robot side is not possible.
To perform this classification the ECG capture system sends an array of 600 samples, these 600 samples are then transformed by the robot to an image as shown below (Figure 26).
Figure 26: Conversion of Noise Signal to Image.

Figure 26: Conversion of Noise Signal to Image.
Figure 27 shows the ECG signal reconstructed in the robot.
Figure 27: ECG signal received by the robot.

Figure 27: ECG signal received by the robot.
The robot uses this image to qualify the pathology, in case the robot detects an anomaly in the signal. It stores the image in a section of the SD memory, in order to have a log of what has happened, so that the image and the signal can be shared with a specialist to obtain a second opinion.
The training of the network that anonymizes the ECG signals resulted in the classification scores presented in Table 3. As can be seen in the table and in the confounding matrix (Figure 28), the classification percentage was satisfactory and a precision of 93% was obtained.
Table 3

Table 3
Figure 28: Normalised confusion matrix of Atrial Fibrillation Classification.

Figure 28: Normalised confusion matrix of Atrial Fibrillation Classification.
iConclusions and Future Work
In this project, we developed a desktop robot capable of moving using a detachable Omni-directional wheelbase. We implemented a series of Deep-Learning models capable of recognizing hand gestures to control the base, emotion recognition using the Portenta H7 vision shield, and the classification of heart pathologies such as atrial fibrillation.
Images
1 / 5
Videos
References:
[1] Philip Joseph, Darryl Leong, Martin McKee, Sonia S Anand, Jon-DavidSchwalm, Koon Teo, Andrew Mente, and Salim Yusuf. Reducing the globalburden of cardiovascular disease, part 1: the epidemiology and risk factors.Circulation research, 121(6):677–694, 2017.
[2] Gregory Y. H. Lip, Laurent Fauchier, Isabelle Freedman, Saul B.andVan Gelder, Andrea Natale, Carola Gianni, Stanley Nattel, Tatjana Pot-para, Michiel Rienstra, Hung-Fat Tse, and Deirdre A. Lane. Atrial fibrilla-tion.Nature Reviews Disease Primers, 2(1), 2016.
CAD, enclosures and custom parts
Code
Credits
Related products


Leave your feedback...