





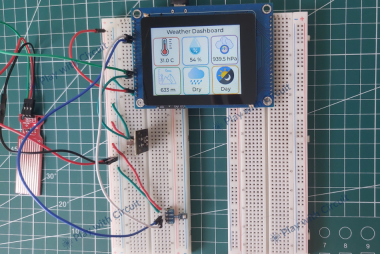
Weather Monitoring System Using Esp32-s3 Smart Display

Made by play-with-circuit / Displays
About the project
Learn how to build Smart Weather Monitoring System Using ESP32-S3 Smart Display and LVGL
Project info
Difficulty: Difficult
Platforms: Espressif
Estimated time: 7 hours
License: Creative Commons Attribution CC BY version 4.0 or later (CC BY 4+)
Items used in this project
Hardware components


Story
In this project, an ESP32-S3 Smart Display is used to build a weather monitoring system that measures temperature, humidity, atmospheric pressure, altitude, rainfall conditions, and ambient light levels. The measured data is presented on an interactive dashboard created with LVGL, giving the system a polished and user-friendly appearance.
How Does the Weather Monitoring System Work?
The system continuously acquires environmental information from different sensors. These measurements are processed by the ESP32-S3 and displayed through a graphical interface.
The overall workflow consists of:
Collecting environmental data.
Processing sensor measurements.
Updating the weather dashboard.
Collecting Environmental Data
The project uses multiple sensors to observe surrounding conditions.
A BME280 sensor is responsible for measuring temperature, humidity, and atmospheric pressure. Since atmospheric pressure changes with elevation, altitude can also be estimated from the same sensor.
Rain detection is performed using an analog rain sensor. The conductivity of the sensor changes when water droplets are present, allowing the ESP32-S3 to determine whether rain is detected.
Ambient light conditions are monitored using an LDR sensor module. Changes in resistance caused by varying light intensity make it possible to distinguish between daytime and nighttime environments.
Processing Sensor Data
The ESP32-S3 integrated inside the smart display acts as the processing unit of the system.
Its responsibilities include:
Reading BME280 measurements.
Acquiring analog values from the rain sensor and LDR module.
Calculating altitude from atmospheric pressure.
Detecting rainfall conditions.
Determining day and night status.
Updating the graphical interface.
By processing sensor readings in real time, the system provides continuously refreshed weather information.
Displaying Weather Information
A graphical dashboard makes environmental data easier to interpret.
Instead of displaying plain text values, the system uses icons and labels to organize information in a more intuitive way. Temperature, humidity, pressure, altitude, rain status, and light conditions are continuously updated on the screen.
Using LVGL for the User Interface
The display interface is built using LVGL (Light and Versatile Graphics Library), one of the most popular graphics frameworks for embedded systems.
LVGL provides components such as:
Labels
Icons
Images
Buttons
Animations
These components make it possible to create visually appealing dashboards even on resource-constrained microcontrollers.
Building the Weather Monitoring System
After understanding the operating principle, the next step is connecting the sensors to the ESP32-S3 Smart Display.
Software Requirements
The firmware is developed using Visual Studio Code and ESP-IDF.
Additional libraries used in the project include:
Bosch BME280 library
LVGL v8
Display support libraries
Circuit Connections
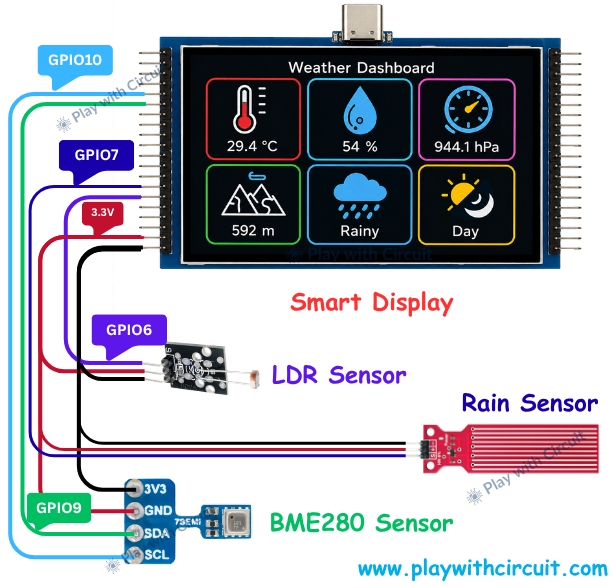
The BME280 sensor communicates through the I2C interface. Its SDA and SCL lines are connected to GPIO9 and GPIO10 respectively.
The rain sensor uses an analog output connected to GPIO7.
The LDR module is connected to GPIO6 and is used for ambient light detection.
All sensors operate from the 3.3 V supply provided by the ESP32-S3 Smart Display and share a common ground connection.
Software Overview
The application follows a modular structure.
main.cpp
This file initializes the display, configures LVGL, creates dashboard elements, and updates sensor values continuously.
sensors.c
This module performs sensor acquisition and environmental condition detection. It provides processed data to the graphical user interface.
Separating sensor management from display logic improves maintainability and makes the project easier to extend.
Applications
The same architecture can be adapted for:
Smart home systems
Greenhouse monitoring
Data logging
Industrial dashboards
IoT weather stations
Environmental monitoring projects
Conclusion
Combining the ESP32-S3 Smart Display with environmental sensors and LVGL makes it possible to build a compact and interactive weather station. Besides monitoring environmental conditions, the project provides practical experience with ESP-IDF, sensor interfacing, and embedded GUI development.
The complete implementation, including source code, ESP-IDF setup, firmware flashing procedure, and detailed circuit explanations on Play with Circuit.
Code
Credits
Related products


Leave your feedback...