
Stream Sensor Data Raspberry Pi Pico W To A React App

Made by mahmood-m-shilleh
About the project
Learn how to stream real-time sensor data from the Raspberry Pi Pico W to a React application with dynamic charts using ApexCharts.
Project info
Difficulty: Difficult
Platforms: MicroPython
Estimated time: 1 hour
License: GNU General Public License, version 3 or later (GPL3+)
Items used in this project
Hardware components

Story
ApexCharts for React is a useful library for creating charts and visualizations in a React application. It provides a wide range of options for customizing the appearance and behavior of charts. This allows developers to create charts matching their applications' design and functional requirements!
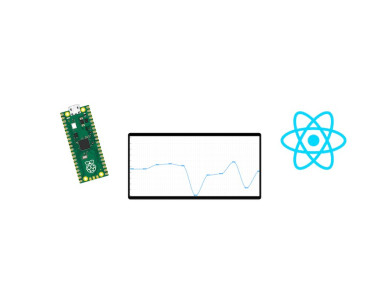
We use 4 stacks of technology in this video, all of which are free!
1-) MicroPython the Raspberry Pi Pico W and a sensor
2-) MQTT Broker HiveMQ
3-) NodeJS Backend with Websockets and HTTP Server
4-) React Frontend with ApexCharts for Dynamic Visualization
There is also a Youtube video for this tutorial if you prefer to watch that. If you do, please like, comment, and sub to the channel!
By the end of this tutorial, you will be able to display data with a real-time graph from any sensor or datastream you like using your Raspberry Pi Pico W.
Step 1: Create a HIVEMQ Account
HiveMQ is an enterprise-level messaging platform for the Internet of Things (IoT) and Machine-to-Machine (M2M) communications. It is a scalable and high-performance messaging solution that enables IoT devices to exchange data in real time.
HiveMQ is based on the MQTT protocol, which is a lightweight, publish/subscribe messaging protocol widely used in IoT and M2M communications. HiveMQ extends the capabilities of MQTT by providing advanced features such as security, reliability, scalability, and management.
Some of the key features of HiveMQ include:
- Scalability: HiveMQ can handle millions of connected devices and billions of messages, making it suitable for large-scale IoT and M2M deployments.
- Reliability: HiveMQ provides reliable message delivery, even in the face of network outages or other disruptions.
- Security: HiveMQ offers a range of security features, including encryption, authentication, and authorization, to ensure the confidentiality and integrity of IoT data.
- Management: HiveMQ provides a comprehensive management interface that allows administrators to monitor and manage the messaging infrastructure.
- Interoperability: HiveMQ is fully interoperable with other MQTT-based systems, making it easy to integrate with existing IoT and M2M deployments.
In summary, HiveMQ is a robust and scalable messaging platform for IoT and M2M communications. It provides the reliability, security, and management features required for large-scale IoT deployments.
To get started using it:
1-) Go to hivemq.com and create a free account here, step through the account creation. You should receive the URL of your cluster. This will be the hostname for the remainder of the tutorial.
2-) Create a user in Access Management, and save the user and password. You will need this to publish information from the Pico W
HiveMQ gives you 10 GB of free storage, more than enough to start testing and you do not need any credit card information which is nice. Seems too good to be true.
Step 2: MicroPython Code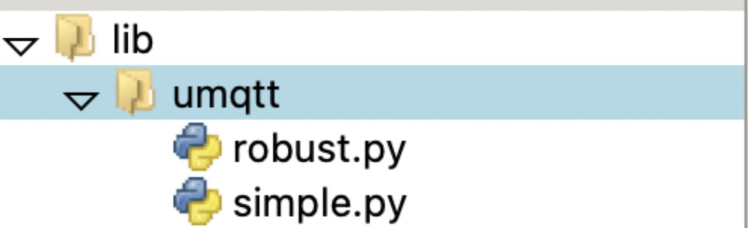
 #Native libs
from machine import Pin, I2C
import network
import time
from time import sleep


#Third Party
from imu import MPU6050
from umqtt.simple import MQTTClient


# Internal libs
import constants


def connectMQTT():
    '''Connects to Broker'''
    # Client ID can be anything
    client = MQTTClient(
        client_id=b"mahmood",
        server=constants.SERVER_HOSTNAME,
        port=0,
        user=constants.USER,
        password=constants.PASSWORD,
        keepalive=7200,
        ssl=True,
        ssl_params={'server_hostname': constants.SERVER_HOSTNAME}
    )
    client.connect()
    return client


def connect_to_internet(ssid, password):
    # Pass in string arguments for ssid and password

    # Just making our internet connection
    wlan = network.WLAN(network.STA_IF)
    wlan.active(True)
    wlan.connect(ssid, password)

    # Wait for connect or fail
    max_wait = 10
    while max_wait > 0:
      if wlan.status() < 0 or wlan.status() >= 3:
        break
      max_wait -= 1
      print('waiting for connection...')
      time.sleep(1)
    # Handle connection error
    if wlan.status() != 3:
       print(wlan.status())
       raise RuntimeError('network connection failed')
    else:
      print('connected')
      print(wlan.status())
      status = wlan.ifconfig()


# Connect to internet and set MPU to start taking readings
connect_to_internet(constants.INTERNET_NAME, constants.INTERNET_PASSWORD)
i2c = I2C(0, sda=Pin(0), scl=Pin(1), freq=400000)
imu = MPU6050(i2c)
client = connectMQTT()


def publish(topic, value):
    '''Sends data to the broker'''
    print(topic)
    print(value)
    client.publish(topic, value)
    print("Publish Done")

while True:
    ax = round(imu.accel.x, 3)
    ay = round(imu.accel.y, 3)
    az = round(imu.accel.z, 3)
    gx = round(imu.gyro.x, 3)
    gy = round(imu.gyro.y, 3)
    gz = round(imu.gyro.z, 3)
    tem = round(imu.temperature, 3)
    # Publish to broker
    publish('picow/ax', str(ax))
    publish('picow/ay', str(ay))
    publish('picow/az', str(az))
    publish('picow/gx', str(gx))
    publish('picow/gy', str(gy))
    publish('picow/gz', str(gz))
    publish('picow/tem', str(tem))
    print("ax",ax,"t","ay",ay,"t","az",az,"t","gx",gx,"t","gy",gy,"t","gz",gz,"t","Temperature",tem,"        ",end="r")
    sleep(3)
Run this code on any file on your Pico W.
Let me explain this code:
1-) Imports:
Most of the imports are standard here but I import from the umqtt library which is a 3rd party library. To do this you need to create a directory called lib with a subdirectory called umqtt (lib > umqtt). I tried to install it through the package manager on the Thonny IDE but it kept giving me errors. Copy the two files listed into the umqtt directory you created so your main script can find the library code:
You will need these to use MQTT functionality on the Pico W.
I also import my constants from another file I have, you do not need to do this. I am just hiding secure information.
2-) connectMQTT()
Connects to the broker that you created when you created your HiveMQ account. Pass in the HiveMQ server URL and the user and password you set up. client_id can be anything, just make sure different machines (the Pico and your Node Server) have different names when subscribing to the client.
3-) connect_to_internet()
Connects you to your internet, just pass in your internet name and password
4-) publish()
Publishes data to the broker in real-time, this is the data NodeJS will be accessing. You need to pass a "topic"; you can get creative and set on your own, this is essentially your own label for the data. I label "ax" for acceleration in the x direction and so on...
------------------------------------
Note that the time.sleep(3) is important because this is the value by which the sensor sends updates to our graph in the frontend. The lower the number, the faster the update is from the sensor, and the faster we can poll for updates on our graph. I am using three seconds because it was a good number for demonstration purposes. The remainder of the code is MPU6050 related. If you want to get that setup or want to understand more about that please see my Youtube Channel. Oh, you can subscribe as well ;)
You should be able to run this code (modify it if you are not using the MPU 6050) if you followed this tutorial properly so far and you have your Raspberry Pi environment set up properly.
Step 3: NodeJSNow I am going to assume you have a simple Node project setup or know how to do one. If you do, the first thing you are going to want to do is npm install the following 6 packages:
- cors
- dotenv
- express
- http
- mqtt
- socket.io
Once that is installed you can modify this code based on your application. This is the code I placed in my index.js file:
const cors = require("cors")
const dotenv = require('dotenv');
dotenv.config();
const express = require("express")
const APP = express()
const http = require('http');
const MQTT = require('mqtt')
const server = http.createServer(APP);
const { Server } = require("socket.io");


// Websocket Server
const io = new Server(server);
//MQTT Information
const HOST = process.env.SERVERHOSTNAME
const PORT = 0
const CLIENTID = `mpu_6050_test`
const CONNECTURL = `mqtts://${HOST}:${PORT}`
const TOPIC = 'picow/ax'
const client = MQTT.connect(CONNECTURL, {
    CLIENTID,
    clean: true,
    connectTimeout: 7200,
    username: process.env.USERNAME,
    password: process.env.PASSWORD,
    reconnectPeriod: 10000,
})


var ax_latest = {};

client.on("error",function(error){ console.log("Can't connect"+error)})

const corsOptions = {
  origin: '*'
}

APP.use(cors(corsOptions))

io.on('connection', function(socket){
  console.log('a user connected');
  socket.on('Client', (message) => {
    console.log(message)
  })
  console.log('Emitting')
  setInterval(function() {
    socket.emit('Echo', ax_latest.value);
  }, 3000);
  socket.on("disconnect", () => console.log("Client disconnected"));
});

client.on('connect', async () => {
  console.log('Connected')
  client.subscribe([TOPIC], () => {
    console.log('Echo', `Subscribe to TOPIC '${TOPIC}'`)
  })
})

client.on('message', (TOPIC, payload) => {
  console.log('Received Message:', TOPIC, payload.toString())
  ax_latest.value = payload.toString()
})

server.listen(80, () => {console.log("Server started")})
At a high level, this code is doing three things:
1-) It is creating an HTTP Server
2-) Initiating our server-side web socket to connect to our frontend React App
3-) Pulling data from one of the topics we created with our MQTT broker
Some other notes about this code:
- You need to sub in your credentials for your HiveMQ account, I used environment variables to mask my sensitive information.
- It uses setInterval in the WebSocket to echo data to our React frontend. I use 3000 milliseconds, aka 3 seconds, which matches the time.sleep(3) value we set in our MicroPython code
- I use a global value ax_latest which is populated by data from our MQTT broker every time there is an update in the topic. This is the value that is being echoed to our frontend.
- You must enable cors to allow communication to your frontend. I use the star to enable all origins. But in production applications, you want to be selective as to what origins you allow for security purposes
- I listen on port 80 which is what we will look for on our frontend.
- Wherever you see "io.on" this is pertaining to our web socket. Wherever you see "client.on", this is referring to our MQTT connection where we are checking to see if we got a message from our broker on the specified channel.
If you have everything set up properly you can run the server with your run command. Many people use "npm start", in my case I used "npm run dev".
Step 4: ReactOnce again, I am assuming you have a simple React project going on, or at least know how to get one started. If so, you need to npm install the following packages:
- apexcharts
- react-apexcharts
- socket.io-client
Next, you want to remove strict mode from your index.js file:
import React from 'react';
import ReactDOM from 'react-dom/client';
import './index.css';
import App from './App';
import reportWebVitals from './reportWebVitals';


const root = ReactDOM.createRoot(document.getElementById('root'));
root.render(
  <React.StrictMode>
    <App />
  </React.StrictMode>
);


// If you want to start measuring performance in your app, pass a function
// to log results (for example: reportWebVitals(console.log))
// or send to an analytics endpoint. Learn more: https://bit.ly/CRA-vitals
reportWebVitals();
As shown above, you need to remove lines <React.StrictMode> and </React.StrictMode>. Otherwise, you will have issues with your web socket communication in which you will get double signaling.
Once that is done I have all of the code needed for generating the graph in my App.js file as follows:
import React from "react";
import io from 'socket.io-client';
import Chart from "react-apexcharts";
import ApexChart from 'apexcharts'

function App() {
  const [pauseData, setPauseData] = React.useState(false);
  const [socket, setSocket] = React.useState(null);
  const [dataStream, setDataStream] = React.useState([
    { x: 0, y: 0 }
  ]);
  const series = [
    {
      name: 'Acceleration',
      data: dataStream
    },
  ];
  const options = {
    chart: {
      id: 'realtime',
      type: 'line',
      animations: {
        enabled: true,
        easing: 'linear',
        dynamicAnimation: {
          speed: 1000
        }
      },
      toolbar: {
        show: true
      }
    },
    dataLabels: {
      enabled: true
    },
    stroke: {
      curve: 'smooth'
    },
    title: {
      text: 'MPU6050 Data Acceleration X (g)',
      align: 'left'
    },
    markers: {
      size: 2
    },
    xaxis: {
      range: 30,
      type: 'numeric',
      tickAmount: 'dataPoints',
      tickPlacement: 'on'
    },
    yaxis: {
      min: -2,
      max: 2
    }}


  async function appendData(dataPoint) {
    var prev = dataStream[dataStream.length - 1]
    if (dataStream.length > 1000) {
      dataStream.reverse().pop()
      dataStream.reverse()
    }
    setDataStream(oldArray => [...oldArray,
      { x: prev['x'] + 3, y: dataPoint} ]);
  }

  React.useEffect(() => {
    const socket = io.connect('http://localhost:80/', {transports: ['websocket', 'polling', 'flashsocket']});
    setSocket(socket)
    ApexChart.exec('realtime', 'updateSeries', [{
      data: dataStream
    }])
    return () => {
      console.log('Disconnecting socket...');
      if(socket) socket.disconnect();
    }
  }, [dataStream]);


  if (socket && !pauseData) {
    socket.once("Echo", data => {
      appendData(data).then(console.log(data))
    });
  }

  return (
    <div>
      <Chart series={series} options={options}  height={1000} />
      <button onClick={() => setPauseData(!pauseData)}>
        Stop/Start Data Stream
      </button>
    </div>
  );
}


export default App;
There is a lot going on in this file but let me try to break some of it down:
- First thing we obviously have are the imports.
- Inside our functional component App() we have three variables.
- One is the pauseData variable which we can use to pause the data stream to our frontend. This is just a boolean.
- We have a socket that is just our client socket. This is set in useEffect upon the first rendering of the component.
- We have dataStream which is just the data used to populate the chart. If this data gets larger than 1000 entries I start to truncate the oldest data points.
- For our graph we need to define a series where we pass the data it uses and options that we need to use for styling the graph as we desire. There are many options for graphs in ApexCharts so I suggest you look at this if this line chart does not suffice for you.
- A very important aspect of the code here is the ApexCharts.exec() function. You need this function to get a smooth update in your graph. Otherwise, it will look finicky as you will see the whole line update every time you get a change in data, which is something you may see in other tutorials. Using ApexCharts.exec() you need to pass in the graph id which in this case we called 'realtime', however, you can pass in whatever graph id you want.
- Other than that we return only two components, a Chart component and a button to stop/start the data stream.
Hope that covers some of the confusion there. If not, my video may be better suited for you for learning purposes which I linked in the description above. If you have everything set up properly you can start to run your backend + MicroPython code, followed by starting your react application. If the wiring is all good, you should start to see a beautiful graph that updates nicely in real-time with your data! Thought it was pretty cool to show everyone this because I did not see a full tutorial on the internet that does anything like this, let alone show a useful dynamic graph that has practical use cases.
Thanks for reading y'all let me know if you have any questions and once again please like, comment, and subscribe to my Youtube channel as I put a lot of work into making this content and sharing it with everyone.
Credits
mahmood-m-shilleh
Mechanical and Software Engineering Background. University at Buffalo 2019 Texas A&M 2021 I make data pipelines for my day job. Outside of work, I participate in online communities regarding Full Stack Engineering, Microelectronics, and more. You can find more details about me on my Youtube Channel. https://www.youtube.com/@mmshilleh Feel free to reach out!
Related products


Leave your feedback...