
How To Plot In Thonny

Made by mahmood-m-shilleh
About the project
Easily plot sensor data in Thonny using the builtin Plotter
Project info
Difficulty: Easy
Platforms: Raspberry Pi, MicroPython
Estimated time: 1 hour
License: GNU General Public License, version 3 or later (GPL3+)
Items used in this project

Story
Plotting is a great way to visualize sensor data in your Raspberry Pi application. Thonny has a simple plotting tool that can be easily integrated into your print statements in MicroPython so you can start plotting right away.
Before getting started, please consider subscribing or supporting channel by donating in the link down below to allow us to produce more content!
Subscribe:
Support:
https://www.buymeacoffee.com/mmshilleh
Step 1-) Select Plotter Tool in the Menu Bar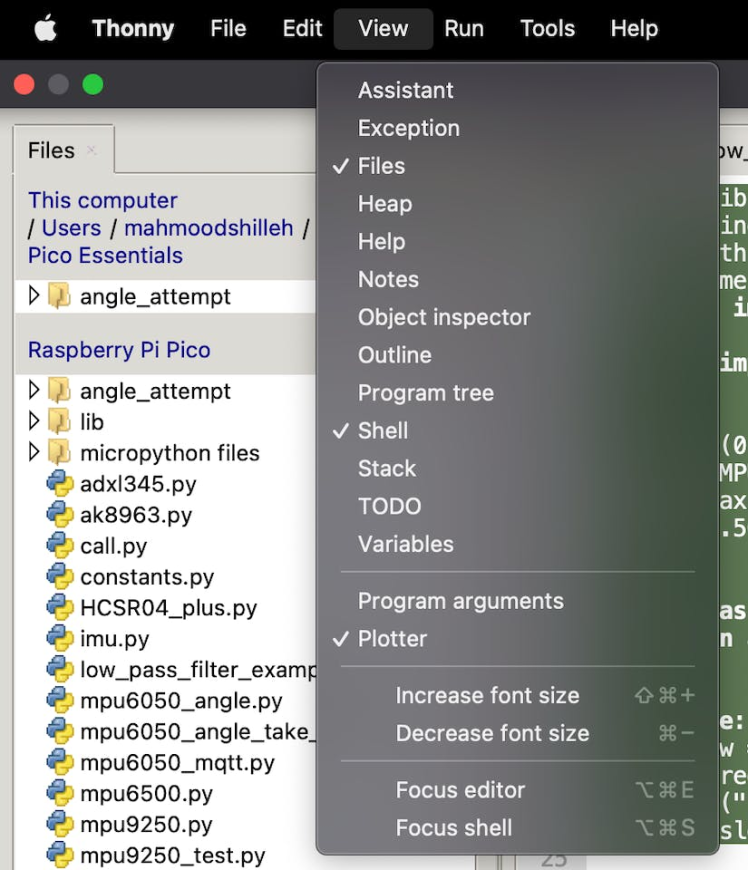
Simply go to View > Plotter
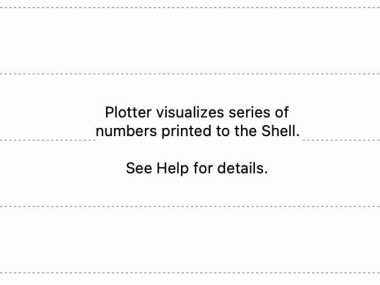
You will see an empty plotter appear on the bottom right.
Step 2-) How to Use PlotterPlotter simply takes the latest print statement and prints it on the screen. You can print multiple graphs on the same plotter by adding them to the print statement as follows.
print("Data 1", datapoint_1, "Data 2", datapoint_2)In the print statement above Data 1 and Data 2 are simply the labels in the legend while datapoint1 and datapoint_2 are just data you get from a data stream. The data will resemble the following:
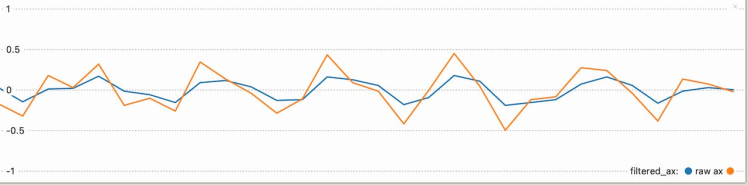
**Note that I changed the labels in this diagram because this is from another project.
You would want to utilize such print statements in a loop mechanism. Due to the simplicity of the plotter, you can only plot simple data streams, multi-dimensional data is not supported by this tool! However, it could be great for some applications.
ConclusionThat is how you make a simple plot in Thonny with no packages needed. You can use this to visualize your data streams in real-time and it can be incredibly convenient.
Please consider subscribing to the channel if you find this content useful. Thanks!
Credits
mahmood-m-shilleh
Mechanical and Software Engineering Background. University at Buffalo 2019 Texas A&M 2021 I make data pipelines for my day job. Outside of work, I participate in online communities regarding Full Stack Engineering, Microelectronics, and more. You can find more details about me on my Youtube Channel. https://www.youtube.com/@mmshilleh Feel free to reach out!
Related products


Leave your feedback...