

Items used in this project
Hardware components

Software apps and online services
Story
We will show you here how you can build an irrigation system for your farm.
Introduction
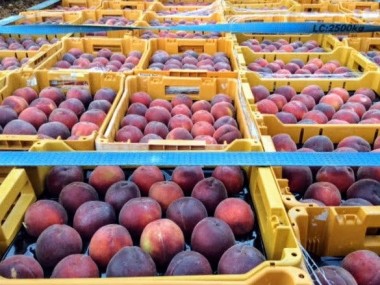
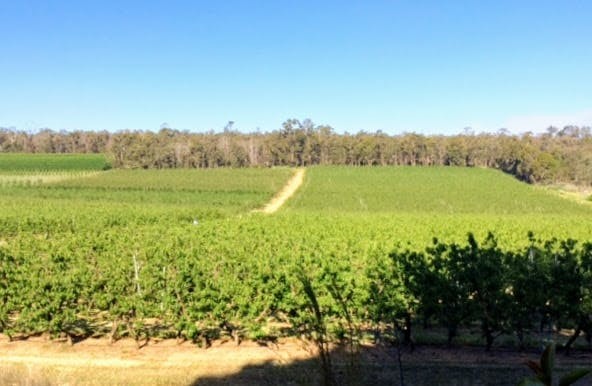
Mark has 5Ha of peaches in the Perth Hills in Western Australia. The trees are planted @1M *5M on an Open Tatura system.
Water is supplied via a single line per row of2.4 L/h pressure compensated drip line @ 0.3M spacing. 30 minutes of irrigation is equivalent to 1mm of rain.
Mark started photonising his irrigation system a year before asking Gustavo to do the programming. He was controlling it manually using the Blynk app and Particle's Tinker. Every time the soil moisture would go under a certain value, Mark would turn an irrigating valve on from his phone or iPad for a period of time.
When he decided the hardware was robust enough and ready for prime time, he contacted me for providing the automation and visualization parts. We joined forces and this project is the result of our team effort.
We hope you enjoy it and find it useful!
Description
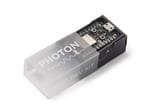
The system consists of 20 zones, each with its own Particle Photon (the microcontroller/the brain). Each Photon is connected to a valve and a moisture sensor. The valve opens the water to irrigate the trees and the moisture sensor reads the moisture of the soil.
The moisture of the soil is being constantly monitored. When it goes under a configurable threshold, the irrigation valve is activated. This valve remains open providing water to the trees for a configurable amount of time. Once the time runs out, the valve is closed and the system rests for another configurable amount of time. This is so the soil is able to absorb the water and the moisture sensor readings become stable.
By default, the system irrigates 15 minutes and then rests for half an hour.
Dashboard
The soil moisture, the threshold value and the valve status are sent to a dashboard on Ubidots. You can observe in the following screenshot the variation of moisture (in green), the threshold value (in blue), and the activity of the valve (when the valve opens the graph shows a red pulse):
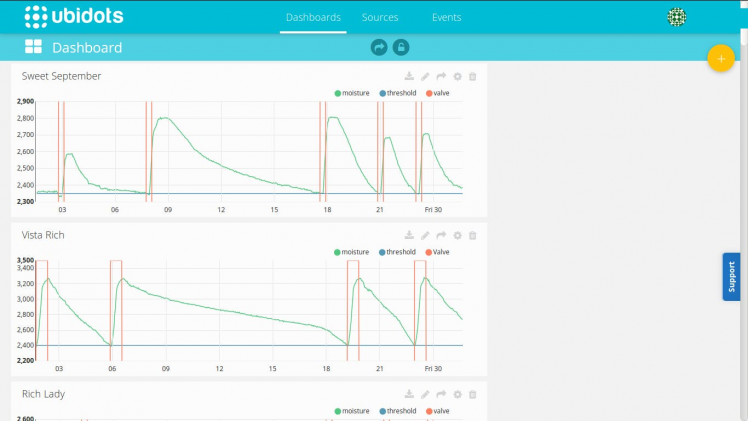 Soil moisture and valve status as a function of time
The amount of time the system is irrigating per day is calculated and then historical data for the last 7 days is kept. This is graphed on Ubidots as well:
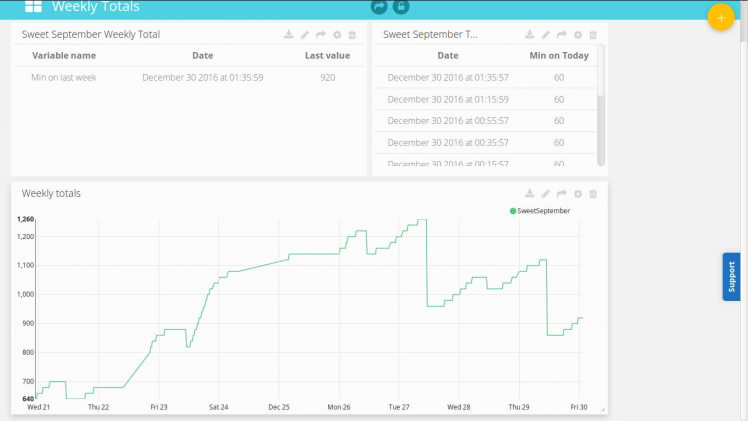 Historical data
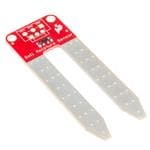
The moisture sensor is a VH400 from Vegetronix. This probe measures the dielectric constant of the soil using transmission line techniques, so it is insensitive to water salinity, and will not corrode over time as do conductivity based probes. It is connected to analog input A0 on the Photon. The sensor was placed vertically, with the top 5cM below ground, and a dripper directly on top.
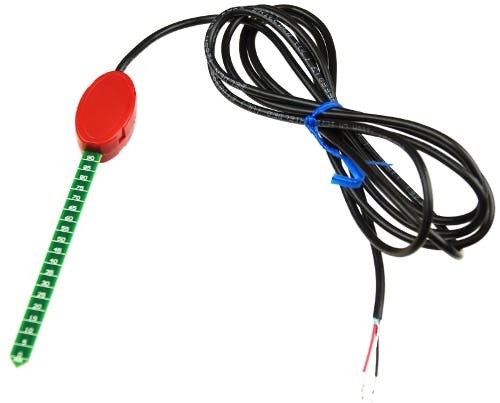 The soil moisture sensor from Vegetronix
Wiring
The soil moisture sensor power is wired to the battery and the output to A0, Relay 1&2 are wired NC battery+, NO wired - The irrigation valve wired to the commons of relay 1 &2. Two momentary PCB switches are mounted on the relay board connecting the +5V to the relay 1&2 activation pads for manual control and troubleshooting.
Connectivity
An Ubiquiti UniFi outdoor+ on an Airmax sector antenna 15db 120 degrees provides internet connectivity.
Most of the Photons require external antennas. The Flex Antenna does the job for most of them but some require bigger antennas. An example of this an be observed on the following picture, where a 12dB panel antenna is connected to a photon that is 400 meters away from the access point:
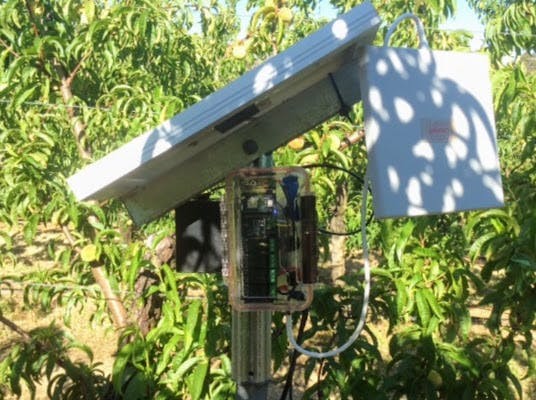 A 12dB panel antenna
 See that Photon far away? Yeah, me neither :)
 A 3 Meters bit of irrigation PVC with a 12 dB flat panel antenna on top
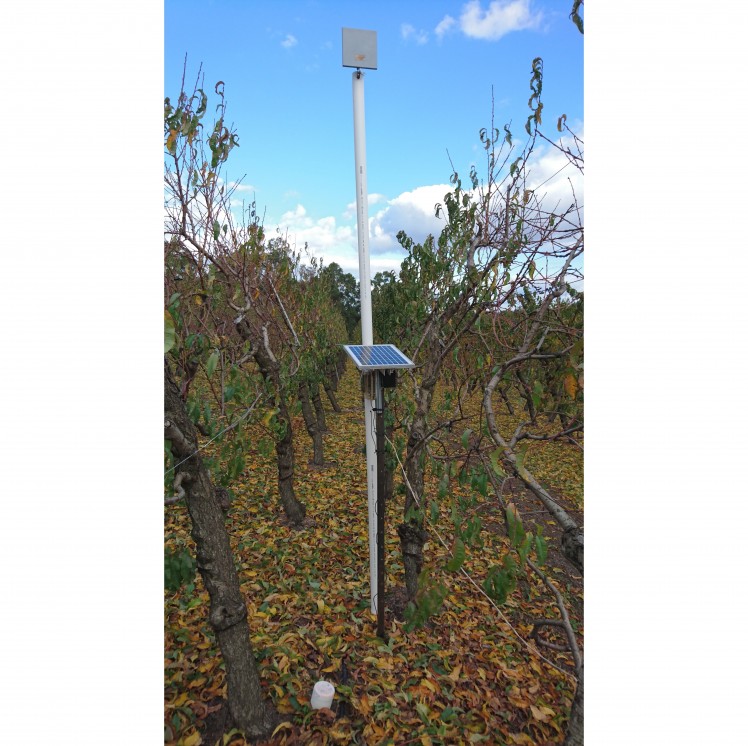
Power
Photons are solar powered with a gel battery charged through a charge controller
To save power, the software was developed to read the moisture sensor every 5 seconds, run its main loop cycle 10 times per second, and publish information to the dashboard in the Ubidots cloud every 20 minutes.
Software
The behavior of the system was modeled using a Finite State Machine, which are wonderful at keeping the code clean and implementing the sequential steps required for making the irrigation work.
Here's how it works:
When the system powers on, the finite state machine (FSM from now on) starts on the initState. After 10 seconds, it automatically transitions to the idleState.
In the idleState, the soil moisture is monitored all the time while the valve is closed. When the moisture goes under the threshold configured, the FSM transitions to the valveOnState. In the valveOnState, the valve is open and the system is irrigating. After 15 minutes, the FSM transitions to the restState.
In the restState, the system waits a while (30 minutes by default) until the soil has absorbed the water. The system then transitions to the idleState and the cycle repeats.
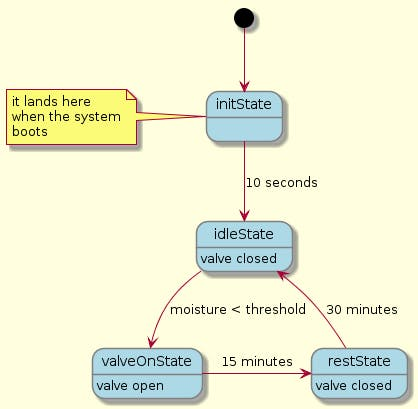 Finite State Machine of one of the valves
And this is the original plan:
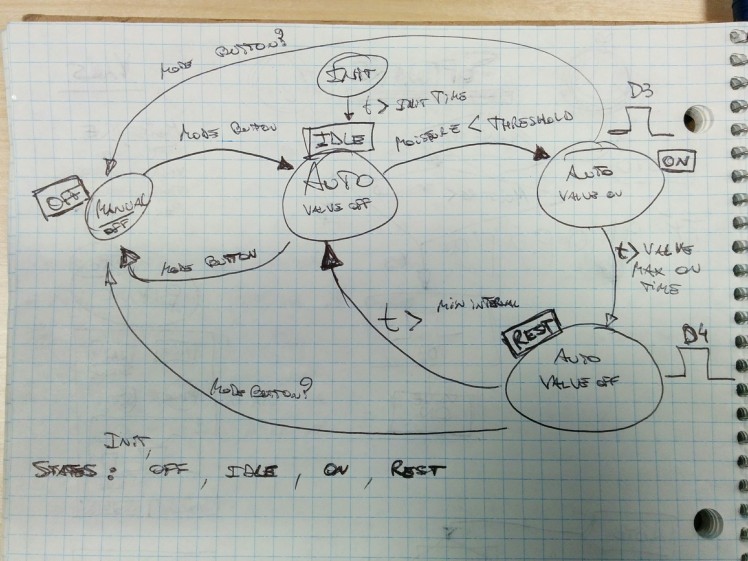 we can agree that the FSM looks better in plantUML :)
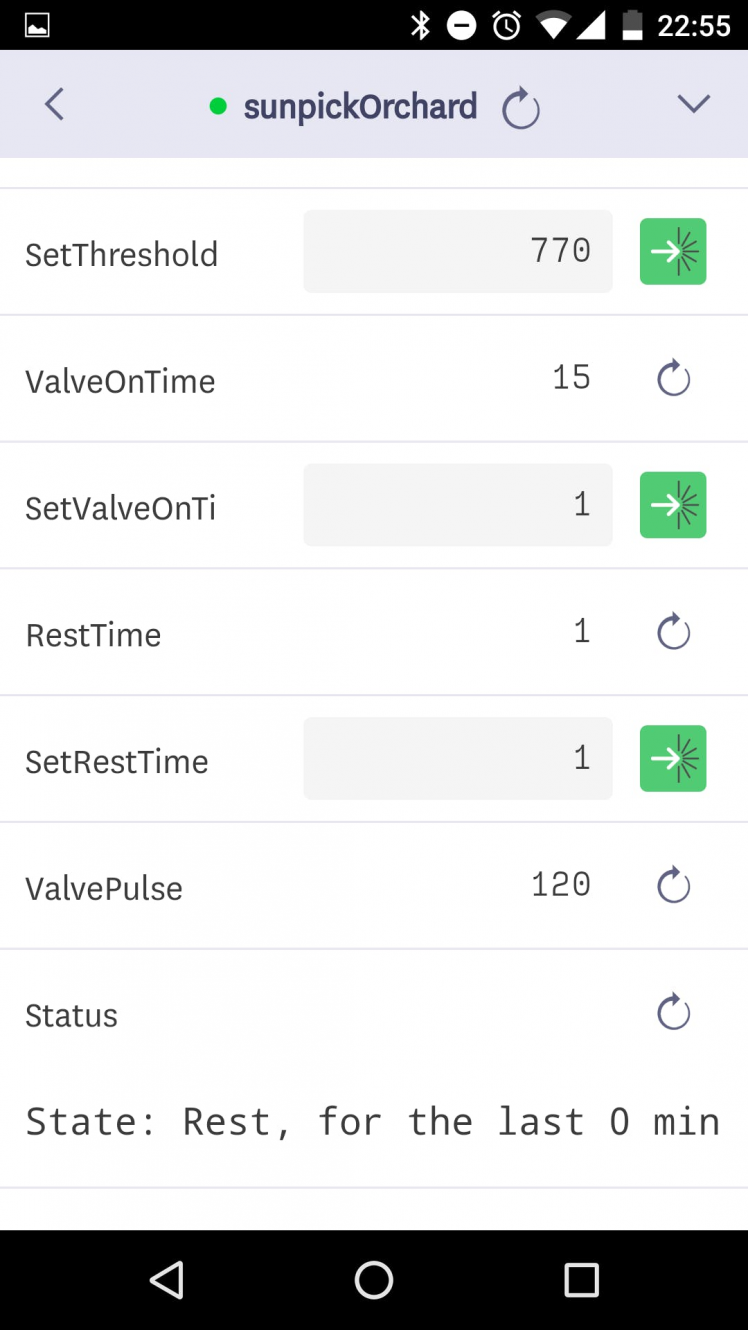
Settings and status
The user can adapt the system to their need. From Porter or the Particle 2.0 app they can:
- set the system on and off
- set the threshold value for the moisture of the soil
- set the valve on time: the period of time the valve is on when the soil moisture goes under the threshold - default is 15 minutes
- set the rest time: the period of time the system shuts off the valve after it remained open - default 30 minutes
Here's a screenshot of Porter:
 The settings in Porter
The user can check the status of the system, the current moisture of the soil as reported by the sensor:
 Status of the system
The user can also check the history of each zone - the system keeps in EEPROM (non-volatile memory) how much time per day the valve was open every day for the last seven days. This is a screenshot, you can observe ValveOnToday, ValveOn-1 (currently named onYesterday), ValveOn-2 (currently named on2daysAgo - the day before yesterday), and so on:
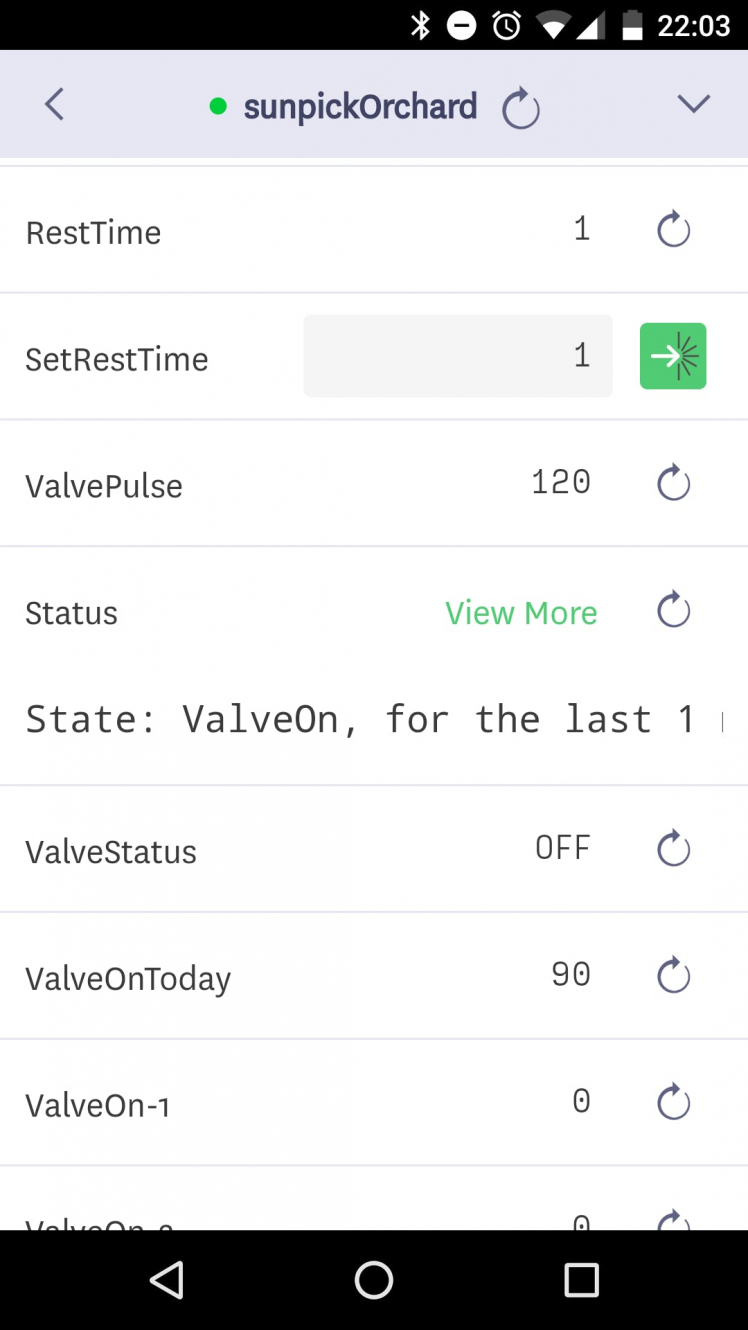 Data for the last week is kept by the system
How to publish data securely to Ubidots
To store data securely to ubidots, we used a webhook hitting the Ubidots HTTPS API. From the Particle docs:
Webhooks are a simple and flexible way to send data from your Particle devices to other apps and services around the Internet. Webhooks bridge the gap between the physical and the digital world, helping you get your data where you need it to be.
You could use a webhook to save valuable information in a database, visualize data being read from a sensor, send the latest weather report to your device, trigger a payment, send a text message, and so much more!
This is how a webhook comes in play in the system at hand:
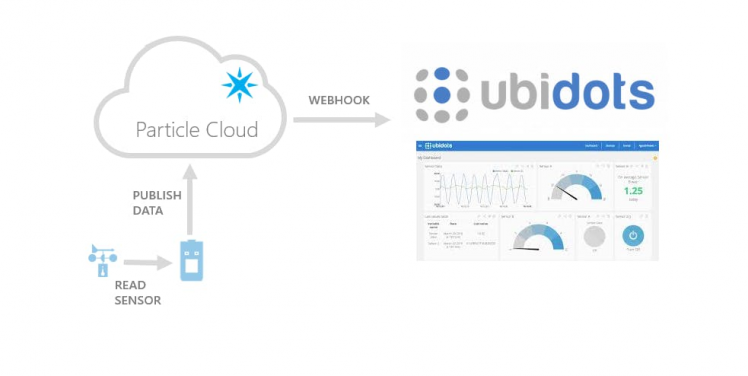 Particle webhook to Ubidots
We require only one webhook for the whole system, since all photons use the same one. Every time there is a Particle.publish() statement in the code, the webhook is triggered and the pertinent data is sent to Ubidots.
You can create the webhook via the Particle CLI or via the Particle Console -> Integrations.
This is the webhook information:
- Event name: ubidots
- Request type: POST
- Device: Any
- Advanced settings:
- Send custom data: JSON
And then enter:
   {
   "value": "{{ubi-value}}"
   }
- include default data: no
- enforce ssl: yes
How to create dashboards on Ubidots
We will describe here how to create a dashboard on Ubidots. Steps 1 through 9 deal with adding moisture and threshold values to an Ubidots line chart, and then steps 10 through 13 deal with adding the status of the valve.
STEP 1: Get an account here. Ubidots makes it simple to get you up and running since they offer free plans.
STEP 2: Create your first dashboard by hitting the Dashboard tab on top and then hitting the yellow + to add a dashboard.
STEP 3: Optional - if you had created a dashboard already, make sure it's unlocked
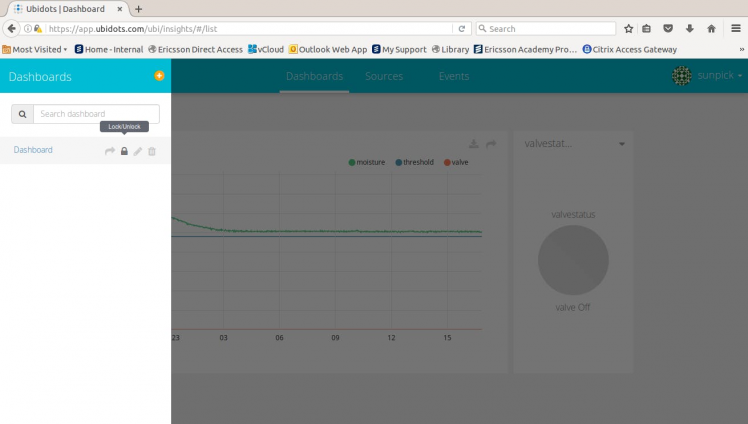 Make sure your dashboard is unlocked
STEP 4: Add a new widget (note the button on the top right corner):
 Add a new widget
STEP 5: In the next screen, select chart -> line chart:
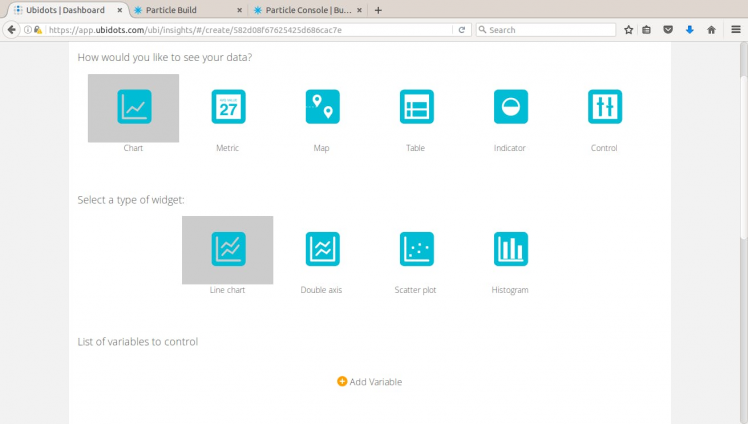 Select Chart and then Line chart
STEP 6: Hit add variable -> select the Photon (write it down!) -> select the moisture variable -> and hit finish:
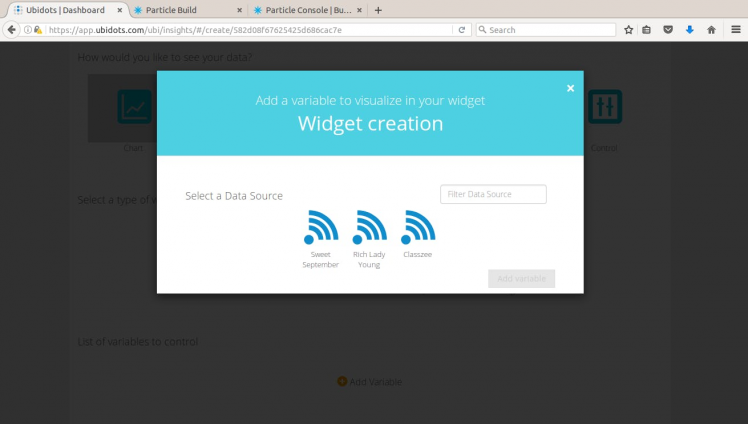 Add the moisture variable
STEP 7: Repeat only step 6, but now for the threshold variable (for the photon that you wrote down).
STEP 8: Hit on finish.
STEP 9: Don't forget to change title of the chart to the name of the Photon you wrote down in a previous step.
Moisture and threshold variables are added to the line chart now. Let's continue with the valve status. The valve status requires a workaround since is a value that ranges from 0 to 1. If we graph it as is (we have tried) you won't see much since moisture values are 3 orders of magnitude higher. So, we simply multiply it by 3500 or 4000, using a variable that Ubidots calls derived. So let's create this variable now:
STEP 10: Hit Sources on top of the page then select the Photon we are dealing with (the one you wrote down):
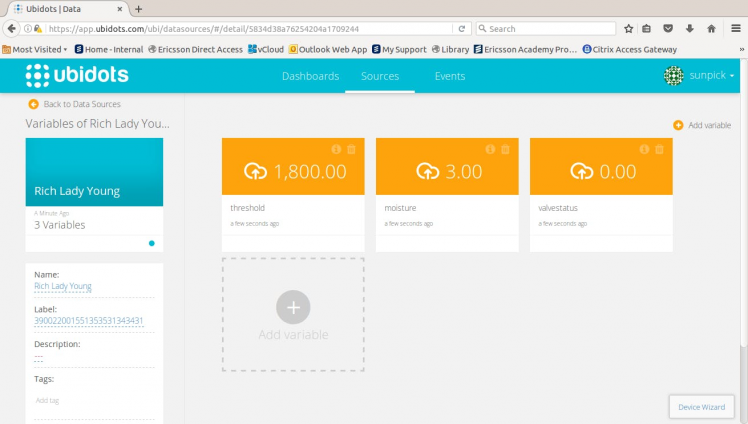 Hit sources on top -> then the photon name (Rich Lady Young in this case)
STEP 11: Hit the Add variable button -> select derived:
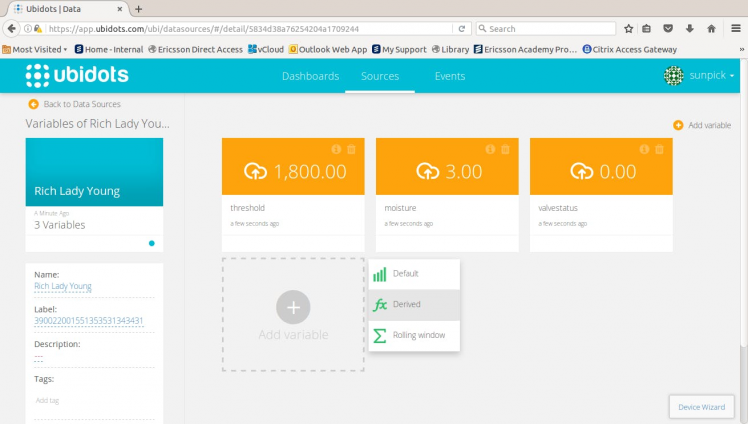 Select Derived variable
STEP 12: On the popup that opens, hit Insert variable, select your photon again, then select the valvestatus variable. On the text field, multiply it by 3500 (you have to enter *3500) - this is an arbitrary value that we selected but you can modify to show taller or shorter the value on the graph:
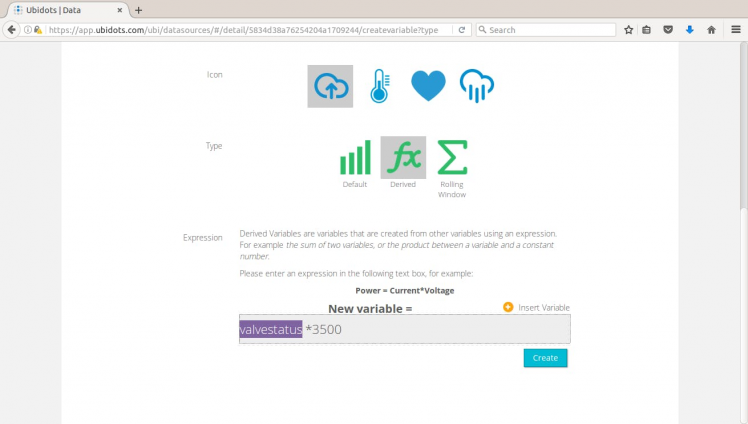 Multiply valvestatus by 3500
STEP 13: Hit on Create and you are done.
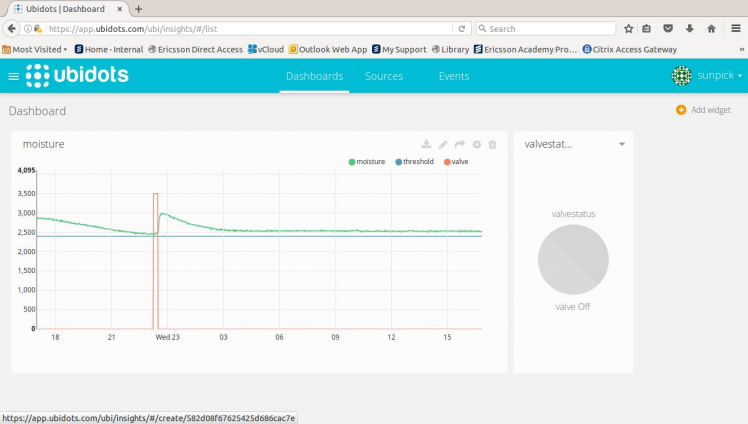
You should now see something like this chart (when the system is working):
 The line chart showing moisture/threshold/valvestatus as a function of time
Conclusion
That's all!
The system was initiated late Spring {Nov} 2016 and worked thru the long dry Summer. Peach yield and quality was excellent with no signs of stress on the trees or the grower. Water use was ½ to ⅓ of a standard program based on evaporation, several thousand dollars of electricity was saved.
We put a lot of effort in documenting the different parts and components, so we certainly hope you find value in this write-up. Feel free to respect it and/or check Gustavo's other projects here.
Leave a comment below if you struggle with something, maybe we can figure it out together.
Mark & Gustavo.
Help
If you require professional help with your projects, don't hesitate to write me a line about your needs at gusgonnet@gmail.com. Thank you!
Schematics, diagrams and documents
Code
Credits
Related products

Leave your feedback...