

Build Your Own Weather Station
Made by Raspberry Pi
About the project
The original Weather Station kit is a HAT for the Raspberry Pi that allows it to collect weather data using a variety of sensors. It is designed to be used in schools to enable students to create their own weather station, and has a range of resources to support its use.
Project info
Difficulty: Moderate
Platforms: Raspberry Pi
Estimated time: 1 day
License: Creative Commons Attribution CC BY version 4.0 or later (CC BY 4+)
Items used in this project
Hardware components


View all
Software apps and online services
Hand tools and fabrication machines
Story
What you will need
There are many different sensors available that you could use to make weather measurements. You don’t have to use the exact same hardware that is described here to build your weather station, but if you choose different components, you will probably need to also find (or write) a Python library that works with them.
The specific sensors and components here were chosen after considering a number of factors:
- Availability
- Cost
- Linux/Python support
- Reliability
- Accuracy
- Ease of use
This does not mean that the components chosen are the cheapest, most accurate, and easiest to use. Rather they are balanced for all these factors. For example, in some cases accuracy has been sacrificed in favour of ease of use.
When selecting the components for your weather station, you should make choices based on what is most important for your particular project. We always like to hear about alternative builds, so please post your designs in the Weather station forum.
Hardware
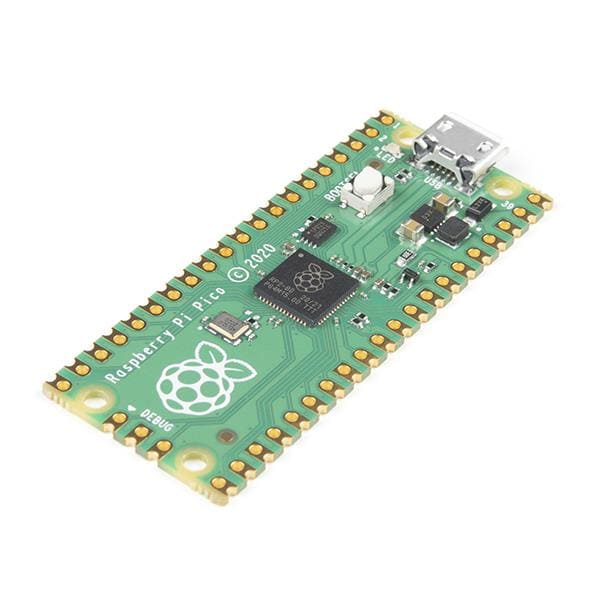
- A Raspberry Pi, either one that has built-in wireless connectivity or has a a WiFi dongle
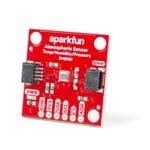
- A BME280 pressure, temperature, and humidity sensor
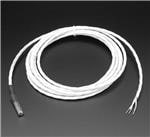
- A DS18B20 digital thermal probe (with 1m lead)
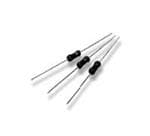
- Two 4.7 KOhm resistors
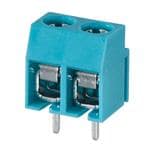
- Some 5mm-pitch PCB mount screw terminal blocks
- A breadboard, some jumper wires
- An anemometer, wind vane, and rain gauge
- Two RJ11 breakout boards (optional)
- A MCP3008 analogue-to-digital convertor integrated circuit
- Weatherproof enclosures; recommended products are this 75x75x37mm box for the BME280 and this larger 150x110x70mm box for the Pi and a soldered HAT; if you’re sticking with a less durable breadboard-only solution, then you may need a larger enclosure such as this 190x140x70mm one
Software
- The Oracle Raspberry Pi Weather Station software. You don’t need to install it, but you’ll use some of the Python programs. Clone the GitHub repository by opening a Terminal window and typing:
- git clone https://github.com/RaspberryPiFoundation/weather-station
- The BME280 Python library:
- sudo pip3 install RPi.bme280
- The MariaDB database server software:
- sudo apt-get install -y mariadb-server mariadb-client libmariadbclient-dev
- sudo pip3 install mysqlclient
Additional resources
If you are going to construct a permanent Weather HAT for your Pi, you may also need:
- A soldering iron, solder, and safety equipment
- Solid core wire (22 AWG)
- An Adafruit Perma-Proto HAT for Pi Mini Kit
- A 16-pin DIL/DIP IC Socket
- Two 2-pin male headers
- General prototyping tools: side-cutters, wire strippers. screwdrivers, etc.
- Insulating tape
- Access to a 3D printer or 3D printing service for these parts: a mount to secure the Raspberry Pi inside the larger box. and a bracket to hold BME280 sensor into the smaller one.
Humidity, temperature and pressure
The BME280 sensor is a digital sensor that can measure temperature, humidity, and atmospheric pressure. It is available in a number of breakout boards from popular manufacturers such as Adafruit and SparkFun. This guide assumes you have the Adafruit package, but the instructions should be applicable to most versions. One thing to check is that the I2C address is correct: for the Adafruit models it is 0x77 (as shown in the code below), but other versions can have different addresses (0x76 is a common alternative).
Wiring up the sensor

- Connect up the sensor to your Pi as shown in the diagram above.
Pi GPIOBME280
17 (3V3)Vin
6 (Gnd)Gnd
3 (SDA)SDA (SDI)
5 (SCL)SCL (SCK)
Some other breakout boards may have other pins (such as SDO or CSB), but those are not generally needed.
- Open IDLE.
Opening IDLE3
IDLE is Python’s Integrated Development Environment, which you can use to write and run code.
To open IDLE, go to the menu and choose Programming.You should see two versions of IDLE - make sure you click on the one that says Python 3 (IDLE).

To create a new file in IDLE, you can click on File and then New File in IDLE’s menu bar.This will open a second window in which you can write your code.

- Create a new Python file, save it as /home/pi/weather-station/bme280 sensor.py, and add the following code to it:
- import bme280
- import smbus2
- from time import sleep
- port = 1
- address = 0x77 # Adafruit BME280 address. Other BME280s may be different
- bus = smbus2.SMBus(port)
- bme280.load_calibration_params(bus,address)
- while True:
- bme280_data = bme280.sample(bus,address)
- humidity = bme280_data.humidity
- pressure = bme280_data.pressure
- ambient_temperature = bme280_data.temperature
- print(humidity, pressure, ambient_temperature)
- sleep(1)
- Now test the code: while the code is running, exhale onto the sensor. You should see the humidity values (and possibly the temperature values) increase. When you’ve finished testing, terminate the code by typing ctrl+c in the Python shell.
Once you’re happy that the sensor is recording sensible values, you can go on to modify the program so that it is ready to be used as part of the whole weather station operation later.
- Replace the while True loop with a function called read_all() that returns the humidity, pressure, and temperature readings, in that order.

Ground temperature
The BME280 will report the air temperature, but this can be significantly warmer than the ground, particularly if it is frosty. A thermal probe stuck into the soil is a useful supplemental temperature measurement and can be used to indicate the presence of ice/frost in winter. The Dallas DS18B20 temperature sensor comes in many forms including a waterproof thermal probe version, and this is the sensor used on the Oracle Raspberry Pi Weather Station.
Wiring up the sensor
- Normally the DS18B20 comes with three bare wires, so the easiest way to prototype and test the sensor is to use PCB mount screw terminal blocks that can also be plugged into breadboards. Add your DS18B20 to your circuit as shown in the diagram below. Note that you are setting up 3.3V and Ground rails along the side of the breadboard. These will be used later when you add extra sensors into the circuit.

- Open the file /boot/config.txt:
- sudo nano /boot/config.txt
- Edit it by adding the line below at the bottom:
- dtoverlay=w1-gpio

- Then open /etc/modules.
- sudo nano /etc/modules
- Add the lines below at the bottom of the file:
- w1-gpio
- w1-therm

- Reboot the Raspberry Pi.
- Open the file /home/pi/weather-station/ds18b20_therm.py in IDLE and run it. You should see the temperature printed out in the Python shell window.

- Put the probe into a glass of cold water and re-run the program. The new temperature reported should be lower (unless you were working in a very cold room in the first place!).
Troubleshooting
- If you are unable to take readings from the DS18B20 sensor, check that the wires from the probe are securely connected to the screw terminals and that you have modified the /etc/modules and /boot/config.txt correctly.
- Open a terminal window and type:
- ls /sys/bus/w1/devices/
You should see two files listed. If these are not shown, then recheck your wiring.

Air quality
The original Oracle Raspberry Pi Weather Station kit used a Figaro TGS2600 sensor for air quality measurements. The batch of devices installed on the Weather Station HAT have worked well, but we’ve noticed that many of the ones we’ve tested recently have been very difficult to calibrate and have produced contradictory readings. They’re fine if you want to detect a general change in the local gases (for example to build a fart detector), but we do not currently recommend them for use in a custom weather station.
We are continuing to evaluate low-cost air quality sensors and will update this guide as soon as we find one we’re happy with.
Active mechanical sensors
So far, all the sensors you’ve used have been passive electronic sensors that just sit there and make measurements of their surroundings. However, to measure things like rainfall and wind speed/direction, you’ll need to use active mechanical devices that physically interact with the environment.
The original Oracle Weather Station kit used popular wind and rain sensors that are used in many consumer weather stations. These are the recommended sensors to use, as they are robust and reliable. Their data sheet gives more information about the sensors’ size and construction.
Connectors
These sensors usually come with RJ11 connectors (they look like a standard telephone jack), which are sturdy and therefore difficult to accidentally dislodge, so your weather station will remain operational even in blustery conditions.
When it comes to connecting them to your Pi, you have three options:
- Chop off the male RJ11 connectors and connect the wires using screw terminals or by soldering.
- Use female RJ11 connectors — these are quite fiddly to use with breadboards, but can provide a very sturdy connection if used with a printed circuit board (PCB) as part of a permanent weather station.
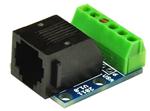
- Use RJ11 breakout boards:
- These can be really helpful for prototyping, but the larger ones can be too bulky for long-term deployment.

- Smaller ones often come with solderable pins that can be used with stripboard or a prototyping HAT to make a durable connection. In the coming steps the assembly instructions for creating a permanent hardware solution will use these smaller breakout boards.

Wind speed
A typical anemometer has three arms with scoops on the end that catch the wind and cause the arms to spin. If you were to dismantle one of the anemometers used by the original Oracle Weather Stations, you would find a small magnet attached to the underside.

At two points of the magnet’s rotation, it triggers a clever piece of electronics called a reed switch, pictured below.

The reed switch has two metal contacts inside it that contact each other when under the influence of a magnet. Therefore, electronically, this switch works in exactly the same way as a button connected to the Raspberry Pi: when the anemometer spins, its magnet passes the reed switch, causing it to form a closed circuit momentarily. Therefore, you can use the number of signals from the reed switch to calculate how fast the anemometer spins.
Whenever the reed switch is triggered, it produces a signal you can detect via a GPIO pin. For each full rotation of the anemometer, the sensor will produce two detectable signals. By counting and timing these signals, you can calculate the speed of the wind.

There are many ways of doing this with Python. One approach is to treat the sensor like a button and then use the gpiozero library to count the number of times it has been ‘pressed’.
Consumer anemometers normally have two wires. Connect one to a ground pin and the other to GPIO 5. If you’re using the RJ11 connectors, the anemometer uses the middle two wires of the cable, which are normally pins 3 and 4 on RJ11 breakout boards.

With the anemometer added, your circuit should look like this:

- Open IDLE, create a new Python file, and save it as /home/pi/weather-station/wind.py.
- Add the lines below to use GPIOzero’s Button functions and set up a Button on GPIO 5. Also create a variable called wind_count to store the number of rotations.
- from gpiozero import Button
- wind_speed_sensor = Button(5)
- wind_count = 0
- Now define a function that will be run whenever the pin is activated by a spin of the anemometer.
- def spin():
- global wind_count
- wind_count = wind_count + 1
- print("spin" + str(wind_count))
- wind_speed_sensor.when_pressed = spin
- Save and run your code. Test it by manually turning the arms of the anemometer. In the Python shell, you should see your code being triggered and the count variable incrementing twice very rotation.

Now you can count the signals from the anemometer, you can use this data to calculate the wind speed.
Calculating wind speed
The anemometer produces two signals per spin, so you can count the number of full rotations of the sensor by halving the number of detected inputs. This can then be used to calculate the wind speed:
speed = distance / time
To calculate speed, you need to know the distance travelled in a certain amount of time. Measuring time is fairly straightforward, and you can count the number of signals over the course of a fixed time period, for example five seconds.
The distance travelled by one of the cups will be equal to the number of rotations multiplied by the distance around the edge of the circle (circumference):
speed = (rotations * circumference) / time
The circumference can be calculated as long as you know either the radius or diameter of the circle.

You can discover the radius of the circle made by the anemometer by measuring the distance from the centre to the edge of one of the cups. Once you know the radius, you can find the circumference with the formula 2 * pi * radius. Don’t forget that a whole rotation generates two signals, so you’ll need to halve the number of signals detected:
speed = ( (signals/2) * (2 * pi * radius) ) / time
The radius for the recommended anemometers used by the original Oracle Weather Station is 9.0cm, and that is the figure that will be used in the code examples that follow. Don’t forget to change this value if your anemometer has different dimensions!
To implement this formula in Python, you can use the math library. For example, if you measured 17 signals from your anemometer in 5 seconds, your wind speed could be calculated like this:
- import math
- radius_cm = 9.0
- wind_interval = 5
- wind_count = 17
- circumference_cm = (2 * math.pi) * radius_cm
- rotations = count / 2.0
- dist_cm = circumference_cm * rotations
- speed = dist_cm / wind_interval
- print(speed)
- Remove (or comment out) the line in the spin function that prints out the wind_count value.
- Now use this formula to modify your wind.py code so that it also calculates the speed of the wind in centimetres per second (cm/s).
I need a hint
Measurement units
Currently, the code calculates the wind speed in cm/s. However, this is not particularly useful — a more practical unit would be kilometres per hour (km/h).
- Modify your code to return the wind speed in km/h.
I need a hint
Calibration
Most anemometers will have a specification that includes calibration data to help you test the accuracy of your sensor. The data sheet for the recommended anemometers says that one rotation a second should equate to 2.4 km/h. So in the example interval of five seconds, five spins (ten signals) should equal the same 2.4 km/h wind speed.
- Run your program and spin the anemometer five times within the first five seconds. What wind speed value is reported?

You’ll probably find that the value doesn’t match the specification. This loss of accuracy is due to something called the anemometer factor, and is a result of some of the wind energy being lost when the arms turn. To compensate for this, you can multiply the reading generated by your program by an adjustment factor.
For the recommended anemometers, this factor equals 1.18.
Update the final line in your calculate_speed function to multiply your speed in km/h by 1.18.
I need a hint
- You’ll need to alter the final print line of your code so that it now shows the output in the correct units.
- Re-run the code, and this time you should get a value closer to 2.4 km/h.
- When you assemble the complete weather station, it will be useful to be able to reset your wind_count variable to zero, so add a function that does that now:
- def reset_wind():
- global wind_count
- wind_count = 0
Wind gusts
Weather reports and forecasts will normally report the wind speed along with wind gust information. A wind gust is a brief increase in wind speed that can occur whenever the wind is blowing. Gusts are more noticeable as the wind speed increases. This is because the force exerted by the wind increases rapidly as the wind speed increases.
Gusts normally occur because the air is not able to move along the ground at a constant speed. Obstacles such as vegetation, buildings, and elevation changes causes surface friction, which will slow the wind down in some places more than others. Air closer to the ground suffers from this phenomenon more than air higher up. This creates a more turbulent wind flow along the ground, which leads to gusts. A typical wind gust lasts less than 20 seconds.
Storing wind readings
When your weather station is fully operational, you can record the maximum wind speed during a given period (the gust) as well as the average speed. You can do this by constantly taking wind speed measurements for five seconds, and temporarily storing them to be processed every few minutes. To do this, we will use a Python data structure called a list.
- Open IDLE, and open the file /home/pi/weather-station/wind.py file that you created in the last step.
- Add a line at the very top to import the statistics library
- import statistics
- Then add this line, which creates an empty list called store_speeds, below the import lines:
- store_speeds = []
- Now modify the while True loop so that it contains a sub-loop that continually takes wind speed readings and adds them to this list. You can then use statistics.mean to calculate the mean value of readings in the store_speeds list.
- while True:
- start_time = time.time()
- while time.time() - start_time <= wind_interval:
- reset_wind()
- time.sleep(wind_interval)
- final_speed = calculate_speed(wind_interval)
- store_speeds.append(final_speed)
- wind_gust = max(store_speeds)
- wind_speed = statistics.mean(store_speeds)
- print(wind_speed, wind_gust)
Notice that we’re using time.time() to create a variable called start_time and then checking when the time has advanced by more than wind_interval seconds in the inner while loop.
- Run you code. Blow on the anemometer or spin it by hand and watch the readings that are produced.

When you stop spinning, you should see that the second reading remains the same (as this is the peak gust that has been produced), while the average speed falls off over time as the anemometer slows down.
Wind direction
Wind vanes
Wind vanes show the direction the wind is coming from, not where it’s going. This can be a little confusing in the beginning, because the arrows on most TV weather maps show the opposite. A wind vane works because wind exerts force on its vertical blade, which rotates to find the position of least wind resistance; this position is aligned with the direction of the oncoming wind.
How your wind vane works
Like the rain gauge or anemometer, the wind vane used here also has reed switches and a rotating magnet, but it is more complex and works in a completely different way.
If you look inside the recommended wind vane, you’ll see eight reed switches arranged like the spokes of a wheel.

There are also eight resistors in the wind vane, and as the magnet rotates, different reed switches will open and close and thus switch their corresponding resistor in and out of the circuit.
The role of the resistors
Resistors are small components that resist/reduce the flow of electrical current without stopping it. Resistors can have different resistance values, reported in ohms Ω; those with low resistance let almost all current through, while those with high resistance let very little current through. The most common uses for resistors are protecting components from being damaged by currents that are too high, or dividing voltage between different parts of a circuit.
Each of the eight resistors has a different value, which you should see printed in white next to it (e.g. you can see 8.2K on the right). This allows the wind vane to have 16 possible combinations of resistance, since the magnet can close two neigboring reed switches when it’s positioned halfway between them. You can find more information in the data sheet.
Most wind vanes you can connect to a Pi work in a similar way, so if you have a different model, consult its data sheet to find the values for the resistors.
Measuring the resistance
In order to read the wind direction from the vane, you’ll need to be able to measure the resistance produced by the sensor and convert that into an angle value. There are several steps in this process.
Instead of measuring the resistance value directly, it is actually much easier to record a voltage from the wind vane that varies according to which combination of resistors is currently switched into the circuit. This means you’ll be measuring an analogue value: the wind vane will continuously report a range of voltages. By contrast, the anemometer simply reports a ‘HIGH’ or ‘LOW’ voltage — all or nothing, meaning it sends a digital signal.
generic-analogue-digital
Analogue and digital
You’ve probably heard the terms ‘analogue’ and ‘digital’ before, but you may not have really understood what they mean. An easy way to imagine the difference between analogue and digital is to think of the average modern-day games controller.

You will notice that on this games controller there are four coloured buttons, and below them a small joystick.
The buttons are all considered digital input devices. This is because they have only two states — ‘pressed’ or ‘not pressed’. If a signal, bit of data, or physical device can only a set number of states, it is digital. The states can be anything: on/off, 0/1, True/False, etc.
The joystick, on the other hand, is an analogue input device, because it can have an almost infinite range of states. You can push it all the way forward, and this might cause the character you’re controlling to travel at their top speed. Move the joystick backwards a fraction, and they’ll slow down. Move it back a fraction more, and they’ll slow down even more. In theory there’s no smallest amount by which the joystick can be moved. Analogue data, signals, and devices can have ranges of states. For example, your game character can travel at any speed between its top speed and being motionless.
Measuring analogue voltages with a Raspberry Pi
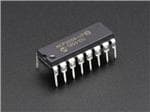
Unlike an Arduino, which has analogue inputs, the Raspberry Pi only has digital inputs. So to be able to interpret an analogue signal, you need a special component called an analogue-to-digital convertor (ADC).
A popular and versatile ADC is the MCP3008. It is a 16-pin integrated circuit (IC) with eight analogue inputs and can easily be used with a breadboard. It is a 10-bit ADC, meaning it has 2^10 = 1024 possible output values: e.g. for a reference voltage of 5V, the smallest change in voltage that the MCP3008 can detect is 5V/1024 = 4.88mV.
Now you can measure a changing analog signal using the MCP3008, you can use another clever circuit to produce a voltage that varies with the resistance of the wind vane.
Using a voltage divider
Voltage dividers are among the most fundamental circuits in electronics, and they’re used to reduce a large voltage into a smaller one.

In the circuit above, the output voltage Vout can be calculated using the formula:
Vout = Vin * R2/(R1 + R2)
So by varying the values of R1 and R2, you can reduce the input voltage Vin down to the output voltage Vout.
- Use this formula to create a new Python program called voltage-divider.py that contains a function voltage-divider that calculates Vout for a given set of R1, R2, and Vin.
I need a hint
- Test your function to make sure it provides the right answer for a selection of input values. For example, when R1 = 33K ohm, R2 = 10K ohms and a reference voltage of Vin = 5V, the function should return an answer of 3.837V.
- print(voltage_divider(33000,10000,5.0))
Now returning to the circuit, if you imagine that R2 is actually the resistance of some kind of variable resistor (a light-dependent resistor, for example), then by measuring Vout, we can calculate R2 as long as we know R1. The wind vane acts like a variable resistor, so you can use a voltage divider circuit to measure its resistance value at any given time.
First of all, you need to find the best value for R1 to use.
Designing a voltage divider
You may have noticed that the second page of the wind vane data sheet contains a voltage divider circuit diagram and a table that lists angle, resistance, and voltage. The value quoted for R1 in this diagram is 10K ohms. However, this circuit uses a Vin reference voltage of 5V. The logic levels on a Raspberry Pi are 3.3V, so these Vout figures are not quite right for what you need.
- Using the list of resistances from the datasheet and the voltage divider formula, write a small Python program called vale_values.py to calculate the new values for a 3.3V Vin with a R1 resistance of 10K ohms.
I need a hint
Using the value of R1 = 10K ohms works well when the reference voltage is 5V, but you should see that some of the possible voltages are quite close together when using 3.3V. By using a smaller value for R1, you can optimise the separation between the different voltages that correspond to the resistance values produced by the vane.
- Use your vane_values.py code to test alternative values for R1. Remember that only certain standard resistance values are available.
The most common in the range you’ll need are (in K ohms):
- 1
- 1.2
- 1.5
- 1.8
- 2.2
- 2.7
- 3.3
- 4.7
- 5.6
- 6.8
- 8.2
You should find that 4.7K ohms is a good value for the recommended wind vane.
- Now you know the value for R1 in the voltage divider circuit, you can wire everything up to your ADC and the Pi.
 Reading values from an MCP3008 ADC is very easy, thanks to the gpiozero library.
- from gpiozero import MCP3008
- import time
- adc = MCP3008(channel=0)
- print(adc.value)
This code will read channel 0 of the ADC and print its value scaled to between 0 and 1. To find the actual analog voltage that’s recorded, multiply the value by the reference voltage supplied to the ADC.
You need to test that your circuit is able to discriminate between the various angular positions of the wind vane. Create a small python program called /home/pi/weather-station/wind_direction_byo.py to count the different values produced by your circuit when the vane is rotated.
I need a hint
- Run your code while rotating the wind vane. Your should see the number of unique voltages seen so far printed out in the Python shell.

- You may also see some red text warning you about ‘SPISoftwareFallback’. You can safely ignore this, but if you’d rather not have the warning appear again in future, click on the Raspberry Pi menu icon and select Preferences > Raspberry Pi Configuration. Then enable SPI in the Interfaces tab, and reboot your Pi.

- If everything is accurate to a very high level of precision, then you should be able to measure no more than 16 unique voltages. However because the ADC may record a rising or falling voltage, you may be able to generate a few more values through slow jiggling of the vane.

- Modify your code to include a list of the possible correct values and check each reading from the ADC against this list. Have your code print a helpful message for each reading that indicates whether it was one of the correct values or not.
I need a hint
The final step is to convert the readings from the vane into angles. At the heart of this is relationship between angle, resistance, and voltage. For every voltage value measured by the ADC, there is a corresponding resistance configuration of the wind vane, which in turn corresponds to the angle the vane’s blade is at.
You can calculate the relationship between resistance and voltage using the voltage_divider function you wrote earlier. You can then look up the corresponding angle from the data sheet. So for example, if the ADC measures aa voltage of 0.4V, this corresponds to a resistance of 3.3K ohms, which maps to an angle of 0 (or 360) degrees.
- Modify your wind_direction_byo.py file and change your list of voltages into a Python dictionary: the voltages will be the keys and the corresponding angles will be the values.
Using key:value pairs in Python
Here is a dictionary of band members. The key is the first part (e.g. ‘john’), and its associated value is the second part (e.g. ‘rhythm guitar’).
- band = {
- 'john' : 'rhythm guitar',
- 'paul' : 'bass guitar',
- 'george' : 'lead guitar',
- 'ringo' : 'bass guitar'
- }
Here’s how to add a key:value pair to the dictionary:
- # Add a key:value pair
- band['yoko'] = 'vocals'
Here’s how to remove a key:value pair from the dictionary:
- # Remove a key:value pair
- del band['paul']
- Then change your print statements so that they display the angle of the vane.
I need a hint
You now have a Python program that reads the angle of the wind vane!
- Test it by setting the wind vane into a certain position and checking that the code displays the correct value. Repeat for different positions.
There is one last improvement you can make to the accuracy of your results, and that is to take multiple readings over a short period of time and then calculate the average value. The maths behind this is more complicated that you might think — you can read about it in detail here.
- Add the function below to your wind_direction_byo.py code.
- def get_average(angles):
- sin_sum = 0.0
- cos_sum = 0.0
- for angle in angles:
- r = math.radians(angle)
- sin_sum += math.sin(r)
- cos_sum += math.cos(r)
- flen = float(len(angles))
- s = sin_sum / flen
- c = cos_sum / flen
- arc = math.degrees(math.atan(s / c))
- average = 0.0
- if s > 0 and c > 0:
- average = arc
- elif c < 0:
- average = arc + 180
- elif s < 0 and c > 0:
- average = arc + 360
- return 0.0 if average == 360 else average
- To use it, you’ll also need to import the math library by adding this line to the top of your file.
- import math
- Now, using a similar technique to how you checked for wind gusts in the previous step, modify your program so that in has a function get_value() that returns the average value for a given time period. This will make it easy to call this function from within your complete weather station code.
I need a hint
Rainfall
Most rain gauges measure precipitation in millimeters in height collected on one square metre during a certain time period.
The recommended rain gauge sensor supplied with the Raspberry Pi Weather Station kit is actually a simple mechanical device.

How does it work?
You can investigate the rain gauge and how it works by removing the bucket. Gently squeeze the clips on either side; the lid should then pop off.

This rain gauge is basically a self-emptying tipping bucket. Rain is collected and channelled into the bucket. Once enough rainwater has been collected, the bucket will tip over, the water will drain out from the base, and the opposite bucket will come up into position.
The product data sheet tells us that 0.2794 mm of rain will tip the bucket. You can multiply this by the number of tips to calculate the amount of rainfall. If you’re using a different type of rain gauge, then you should consult the relevant data sheet or determine the volume of water required experimentally.
Typically these gauges are fitted with an RJ11 plug even though they only use two wires: one red and one green. Inside the ridge between the two buckets, you should see a small cylindrical magnet that points towards the back wall. Inside the back wall there’s a reed switch.
The top of the back wall does come off if you want to see inside; just pull on the flat end gently and it should release. Inside there’s a small circuit board that you can remove to examine. In the middle of it you will see the reed switch. Replace the circuit board and back wall lid before continuing.
When one of the buckets tips, the magnet passes the reed switch, causing it to close momentarily. So, just like with the anemometer, if you connect the rain gauge to a GPIO pin on the Raspberry Pi, you can treat it like a button and count the number of ‘presses’ to calculate rainfall.
Connecting your rain sensor
- To test the rain gauge, you’ll need to either remove the RJ11 connector and strip the wires, or make use of an RJ11 breakout board.
The Oracle Weather Station rain gauge is connected to GPIO pin 6 (BCM), so for consistency, use the same pin for your device.

- Using the code you wrote for the anemometer as a starting point, write a program called /home/pi/weather=station/rainfall.py to detect when the rain gauge bucket has tipped. It should print our a running count of how many bucket tips have occurred.
I need a hint
Now that you can count bucket tips, you need to convert this into a height of water that equals the amount of rain that has fallen.
- Modify your code to print the height of rain that has fallen each time the bucket tips.
I need a hint
- Finally, add a function reset_rainfall to reset the count of bucket tips so that it starts at 0 again.
I need a hint
Fully functional weather station
Now that you’ve tested all the sensors individually, it’s time to set up the software so that you have a complete data collection system. 
The original Oracle Raspberry Pi Weather Station uses a Unix daemon approach to running the software, and the GPIO connections you’ve been using so far match those expected by this software. Therefore, you can adapt that code to run your custom build by only making slight modifications. In fact, you’ve already used the original Oracle Weather Station code for the DS18B20 digital thermal probe.
To complete your custom weather station, you can also adapt and integrate the code you’ve written for testing to regularly measure and record data.
Wind speed, gusts and direction
The code you wrote for wind speed and gust measurement will form the basis of your overall weather station software.
- Make a copy of your wind.py script and call it weather_station_BYO.py (you can can do this in IDLE by opening wind.py and then clicking Save as).
You will need to add some additional libraries and some of the Oracle Weather Station code along with programs you’ve already written.
- The top of your script should have the following import statements:
- from gpiozero import Button
- import time
- import math
- import bme280_sensor
- import wind_direction_byo
- import statistics
- import ds18b20_therm
As it currently stands, your code will continually record the wind speed every five seconds, keeping track of the largest measurement (gusts) and calculating the mean speed. You can extend this to also simultaneously measure wind direction.
- Modify your code so that instead of pausing for five seconds in each loop, the program takes five seconds worth of wind direction measurements.
I need a hint
- Test your code by spinning the anemometer and wind vane. Does the program produce sensible values?
Right now your program is constantly updating the mean values and peak wind speed as new measurements are made. Your weather station should start afresh with each five seconds of measurement.
- Add two lines to your code to empty the lists that hold the wind speeds and directions after every pass through the loop.
I need a hint
- Test your code again.
You should see that you are recording the angular position of the wind vane, and counting the rotations of the anemometer for five seconds. Your code then calculates the mean wind speed and average position of the vane for that period. You will have also noticed that the value for wind_gust is now always the same as the mean, because you are emptying the list of speeds after every five-second period — so there is only ever one value (the last one).
Five seconds is a nice sample period, but is too frequent if you want to store new measurements. To keep a permanent record, a better period of measurement would be every 5 minutes. You can collect five minutes worth of readings, and then record the peak value (gust) from that collection of measurements. That is much more useful!
- Modify the code so that it uses a a sampling frequency of five seconds for its readings, and then calculates new mean speeds and wind directions and records the strongest gust every five minutes.
I need a hint
- Test your code. It should now report readings every five minutes. Simulate some wind activity by rotating the vane and anemometer and check that your measurements are what you’d expect.
Now you can add the other sensors into this five-minute loop!
Rainfall
Integrate the code your wrote for measuring rainfall in rainfall.py into your weather_station_BYO.py program so that rainfall is measured for five-minute periods and then the count reset.
- Add the bucket size constant definition to the list of other similar variables after the import statements.
- BUCKET_SIZE = 0.2794
- Add these lines before the while True: loop.
- def bucket_tipped():
- global rain_count
- rain_count = rain_count + 1
- #print (rain_count * BUCKET_SIZE)
- def reset_rainfall():
- global rain_count
- rain_count = 0
- rain_sensor = Button(6)
- rain_sensor.when_pressed = bucket_tipped
- Then, after the lines that calculate the wind gusts and speed, add this code:
- rainfall = rain_count * BUCKET_SIZE
- reset_rainfall()
Temperature, pressure and humidity
When you wrote the code for the BME280 pressure, temperature, and humidity sensor, you created a read_all function to return all three measurements. You can call this function from within weather_station_BYO.py as you’ve included your bme280_sensor program as an imported library.
- Modify your code so that the readings from the BME280 sensor are also recorded every five minutes.
I need a hint
- Test your code. Exhale onto the BME280 and check that the readings change appropriately.
Ground temperature
- Now do the same thing for the ground temperature probe. Modify your code so that readings are collected every five minutes.
I need a hint
Storing measurements in a database
One of the best ways to store your weather data is in a database. Databases can store very large numbers of records efficiently and make it easier to sort, search, and analyse your data.
There are many different pieces of database software, and MariaDB is a good, versatile general-purpose product. You should have already installed it — if not, head back to the What you will need section and follow the instructions there.
Now to configure the database.
- The database server will already be running. To connect to it, open a terminal window and type:
- sudo mysql
You should then see that the command line prompt changes to be MariaDB [(none)]>. Type the configuration commands at this prompt.

- First create a user and a password. You can choose whatever username you want, but make sure it has a strong password and that you remember the password you set.
- create user pi IDENTIFIED by 'my54cr4t';
The command above will create a user named pi with the password my54cr4t.
- Assign all permissions to this user.
- grant all privileges on *.* to 'pi' with grant option;
Remember to change pi to whatever username you created in the previous step.
- You can have more than one database on a server. Create one called weather to hold your data:
- create database weather;
- Your database should have a table called WEATHER_MEASUREMENT that will hold all of your records. First, select the weather database as the place where this table will be stored:
- use weather;
You should now see the prompt change to MariaDB [(none)]>.
- Create the WEATHER_MEASUREMENT table with fields to hold your weather data.
- CREATE TABLE WEATHER_MEASUREMENT(
- ID BIGINT NOT NULL AUTO_INCREMENT,
- REMOTE_ID BIGINT,
- AMBIENT_TEMPERATURE DECIMAL(6,2) NOT NULL,
- GROUND_TEMPERATURE DECIMAL(6,2) NOT NULL,
- AIR_QUALITY DECIMAL(6,2) NOT NULL,
- AIR_PRESSURE DECIMAL(6,2) NOT NULL,
- HUMIDITY DECIMAL(6,2) NOT NULL,
- WIND_DIRECTION DECIMAL(6,2) NULL,
- WIND_SPEED DECIMAL(6,2) NOT NULL,
- WIND_GUST_SPEED DECIMAL(6,2) NOT NULL,
- RAINFALL DECIMAL (6,2) NOT NULL,
- CREATED TIMESTAMP NOT NULL DEFAULT CURRENT_TIMESTAMP,
- PRIMARY KEY ( ID )
- );
Now you can modify your weather_station_BYO.py program to record data in this database. Once again you can use code from the Oracle Raspberry Pi Weather Station software.
- Add this line to the top of weather_station_BYO.py:
- import database
- Just before the main while True loop, add this line to connect your code to the MariaDB database:
- db = database.weather_database()
- Then finally, below the line in the main while True loop that prints your data readings, add this line to insert a row of records into the database:
- db.insert(ambient_temp, ground_temp, 0, pressure, humidity, wind_average, wind_speed, wind_gust, rainfall)
- Save your code. Now using nano or another text editor, modify the /home/pi/weather-station/credentials.mysql file so that it contains the username and password you created for your MariaDB database.
- {
- "HOST": "localhost",
- "USERNAME": "pi",
- "PASSWORD": "my54cr4t",
- "DATABASE": "weather"
- }
Test your weather_station_BYO.py program
You may see warning messages about truncated values, but these can be safely ignored.
- Run the code for a while to allow it to record several values (you can always adjust the value of the variable interval to a smaller number if you’re impatient and don’t want to wait five minutes in between each iteration).
- Check that no errors are produced (except for the warnings about truncated values, which you can ignore).
- Open a terminal window and connect the the MariaDB database:
- sudo mysql
- Select the weather database:
- use weather;
- Then run this SQL query, which will tell you how many rows are in the WEATHER_MEASUREMENT table:
- select count(*) from WEATHER_MEASUREMENT;
This should display a number that matches the number of times your code has recorded a weather data measurement.

Assembling everything for outdoors
Wireless connectivity
So that your weather station can upload data to somewhere you can view and analyse it, it will need some form of internet connection. Using WiFi is typically the easiest way to do this, but you can use the ethernet connection if that works better for your location. There’s a guide about setting up wireless connectivity on your Raspberry Pi here, and some special hints for getting wireless access working with a weather station are here.
Make a weather station HAT
You should now have a working weather station prototype on a breadboard. If you are happy keeping your weather station in this form, then click through to to the Keeping your weather station dry section.

For a more robust, long-term installation, or if you don’t have room for a breadboard in your enclosure, you can construct a weather station HAT (hardware attached on top) for your Pi. This will involve some soldering, and if you’ve never soldered before, we have a great resource plus video tutorial to get you started.
Note that to really be able to call it a HAT, your board should include a programmed EEPROM. The Adafruit Perma-Proto HAT kit does come as a variant with an EEPROM so this is definitely something you could do, although we won’t cover the procedure in this guide. A good place to start is this github repository, or this MagPi article.
If you are going to solder your project using the recommended components, make sure to read through all the instructions before starting. The assembly is a little tricky, and it will taken even an experienced maker two to four hours.
As usual, there is more than one way to do this this. You could design a layout for stripboard (also known as veroboard).

Soldering stripboard connections can be trickier than the ‘through-hole’ type you may be familiar with from assembling other digital making kits. However, prototyping HATs for Raspberry Pi are also available and these have plated through hole (PTH) connections that are much easier two work with.
The circuit diagram below shows a possible design for a weather station HAT using the Adafruit Perma-Proto HAT Kit. You can lay things out differently if you have used alternative components.

Things to note about this circuit diagram
- To avoid cluttering the view, the six pins for each of the two RJ11 breakout boards are shown as female headers.
- Interpreting this diagram requires a slightly different approach to building a breadboard circuit. Because the PTH connections go all the way through the board, you can actually (and usefully) route and connect wires and components on either side.

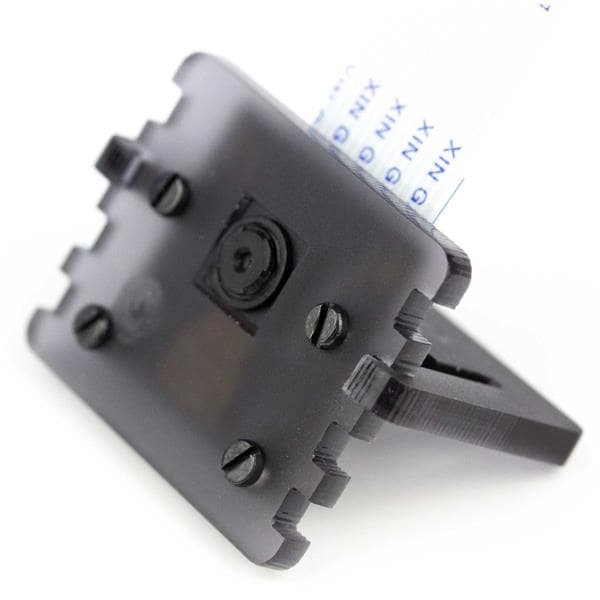
In the photo above, you can see that two 2-pin male connectors have been used for the BME280 sensor. This method makes assembly easier, because the sensor should be housed in a separate enclosure. However, you could solder the wires connecting the sensor directly to the HAT (after threading them through the water-tight glands or grommets used).
Assembly
You are recommended to assemble and test things one step at a time, checking each connection to a weather sensor once you’ve added it to the board.
- First of all, solder the 40-pin header onto the Adafruit board.

- Solder on two 2-pin male headers, one across the SCL and SDA connections in the top left-hand corner, and one across the 3V and GND rails.

- Connect the BME280 sensor to these pins and place the HAT on the Pi.
- Boot the Pi and test that the BME280 sensor works using the bme280_sensor.py code that you wrote earlier.

Next, add connections for the DS18B20 probe. On the breadboard you used screw terminals. You could use them again on the proto-board, but you may have noticed that one of the RJ11 breakout boards has some unused pins. You can be sneaky and make use of the unused screw terminals to save space: the rainfall gauge only uses the two centre pins of the connector, so the two outer ones on either side are free.
- Power down the Pi and remove the HAT.
- Solder a 4.7K ohms resistor in the bottom area as shown. Your RJ11 breakout board will need to sit just above this, so try to seat the resistor so that it is flat against the top of the Adafruit board and not poking upwards.

- Now add two connections to the bottom GND rail using small lengths of wire.

- Then add longer wires to connect the GPIO pin breakout connections (GPIO 4, 6) and the 3V rail. Once again, try to keep these as low as possible where the RJ11 breakout board will sit. As mentioned earlier, you can solder the wires through from the bottom of the HAT rather than across the top. As long as the correct holes are connected together, it doesn’t matter which side of the HAT you use.

The connection to the 3V rail will pass through a ‘busy’ part of the board if it goes over the top, so this is a good choice to put it on the rear.

- Now prepare the RJ11 breakout board. Some of the pre-soldered parts of these breakout boards can be quite spiky. To avoid these peaks of solder from causing shorts when placed onto the Adafruit board, carefully trim them with side cutters. It is also a good idea to then cover them with a small strip of insulating tape.

- With some versions of the smaller boards, the male pins you need for connection to the Adafruit board are supplied separately. You may have to solder them onto the breakout board first. Make sure the shortest end of the pin is the part that you solder on, as the longer end is the part that you’ll solder onto the Adafruit board.

- Solder the RJ11 breakout board in place, making sure that the pins slot into the correct place on the Adafruit board. Be careful not to melt the plastic on the RJ11 socket. The pins from the breakout board are quite long and will make contact with the HDMI port on the Raspberry Pi when the HAT is in place. Therefore, you should either trim them or use some insulating tape on the top of the HDMI port to prevent a short circuit.
- Connect the DS18B20 sensor to the screw terminals on the breakout board as shown below.

- Carefully remount the HAT on the Pi. Before powering up the Pi, check that none of the soldered connections on the bottom of the Adafruit board are touching the top components on the Pi. If they are, trim the wires or pins in question.
- Power up the Pi and test your DS18B20 sensor using the ds18b20_therm.py script.
- Connect the rain gauge’s RJ11 connector to your HAT.
- Test that the rain gauge works using the rainfall.py scripts you’ve written.
Now you need to add the MCP3008 ADC. While you can solder the IC directly onto the Adafruit board, it is much better to use a DIP/DIL IC socket. This reduces the chance of damage to the IC and also makes it easier to swap components out in future.

- Remove the HAT and solder the socket onto the Adafruit board, in the position shown by the MCP3008 IC in the diagram.

- Now use five short strips of wire to make connections to the 3V and GND rails for the IC and the second RJ11 breakout board.

- Using some longer wire strips, add in the other connections to the GPIO pins. You can use either the front or the back of the board to route these connections, although soldering the GPIO ends near the black plastic of the female header on the back can be trickier than on top.

- Add two final wires for the wind vane part of the circuit.

- Then solder on the second 4.7K ohms resistor.

- The final step is to add the second RJ11 breakout board, remembering to ensure that no short circuits are caused by spiky or long pins protruding from the bottom of the board.

- Carefully insert the MP3008 IC into the socket. You may need to gently bend the legs slightly so that they fit in without being crushed under the main body of the chip itself.
- Remount the HAT on the Pi again. Check that none of the soldered connections on the bottom of the Adafruit board are touching the top components on the Pi. Trim any wires or pins if they are.
- Plug in the RJ11 connector from the wind sensors and test them using the wind_direction_byo.py and wind.py scripts you wrote.
- You should now have a fully working weather HAT. Test it for a while with the full program that you completed in the previous step.
Keeping your weather station dry
This is really important. If the Pi or any of the electronics gets wet or even very damp, they will fail or start to corrode. The Oracle Raspberry Pi Weather Station uses a small weatherproof enclosure to house the external environmental sensors. The key idea is to allow outside air to flow around the sensors but to prevent moisture from reaching them.
Weatherproof boxes
- Find two waterproof enclosures, one larger one for the Pi and the breadboard or HAT, and another smaller one for the BME280 sensor. The larger box should have a couple of holes for the RJ11 cables connecting the wind and rain sensors, and for some long wires to the BME280.
- Most commercial enclosures will have holes for routing cables, some with grommets that help keep out moisture. Alternatively, you can cut or drill your own holes and use grommets and sealing glands around the cables.
- If you’re using the recommended enclosures as listed in the What you will need section, then you can use this 3D-printable mount to secure the Raspberry Pi inside the larger box. and this one to hold BME280 sensor into the smaller one.. The BME280 bracket should just slot in.

- Use short self-tapping screws to secure the mounts into the holes and/or grooves at the back of the larger box.

- In oder to get representative readings for ambient temperature and humidity, air needs to circulate around the BME280 sensor. Remove both hole covers from one side of the smaller box. You can then pass the wires for the sensor up through one hole. Make sure you mount this box outside with the holes are facing downwards so that rain cannot enter this way.

- Use waterproof nylon cable glands to prevent moisture entering the enclosure through the holes used for the cables. If the glands don’t fit snugly around the cables, you could 3D print some grommets or wrap electrical tape around the cable to make a tighter seal.
- The larger recommended enclosure has holes on all four sides that are sealed with rubber plugs. Use three of these holes along the bottom of the box to provide an escape route for your cables. Use a M16 cable gland in each of the two outer holes and pass the cable for the rain gauge through one and the cable for the wind sensors through the other.
- If you’re using the Ethernet cable to provide wired network access for your weather station, you may need to use a larger gland or an extra one of the holes in the enclosure.

- Then use the larger M20 gland for the centre hole and feed the power cable, DS18B20 probe, and the wires for the BME280 sensor through.

- The hole in the M20 is quite large, so you should pad the cables to ensure a tight fit (if you use a smaller gland, then the micro USB connector for the power cable would not be able to pass through). A 3D-printable grommet is available here. — use two rotated at 180 degrees to each other so that there is no gap all the way through.
- The larger box can be installed inside, making it much easier to keep it dry, and allowing easier connection to power and networking. However, the various cables for the external sensors (rain gauge, wind vane, anemometer, and BME280) all need to be routed inside so this may involve a bigger hole in an external wall. Mounting everything outside means you only have to supply power to the weather station (assuming you are using wireless connectivity for data transfer).
Now you’re ready to install your weather station outside. You could mount your station on a wall, rooftop, fence, or even on a plumbing pipe stuck in the ground. As long as the sensors are open to the elements, any location is fine. Don’t forget:
- The rain gauge needs to collect rain
- The anemometer and wind vane need to be in the wind
- The smaller BME280 box needs to breathe — try to avoid situating it in direct sunlight
- The weather station needs to be connected to power, and to a network (wirelessly or via an Ethernet cable)
It is not possible to provide specific instructions for mounting your station, as the exact method will depend on your particular location and environment. However, here are some tips for a couple of aspects of the process that should help you get started:
You may not be able to find an ideal location. Perhaps trees block the wind, or the rain gauge is partially sheltered by an overhang. Don’t worry, just install your weather station anyway! You could even use this as a learning opportunity: for example, would it be possible to take reduced rain readings into account automatically? If airflow around the BME280 is limited, could you add in a small fan?
Share your design
Now that you’ve built your own weather station, why not share your design and installation with the community? If you’ve used different sensors or chosen another circuit layout, please post the details on the Weather Station forum. We always love to see photos of weather station builds, and we might even feature them on our blog on in weather station newsletters.
Challenge: add custom sensors
- Now you’ve got your weather station up and running, why not add some more sensors? You have seven free pins on the MCP3008 ADC, so you could incorporate more analog sensors!
- How about a light meter or UV sensor? How could you keep it watertight?
- Or maybe you could add a lightning detector — there are a few commercial boards available for doing this.
Code
Credits
Raspberry Pi
Our mission is to put the power of computing and digital making into the hands of people all over the world. We do this so that more people are able to harness the power of computing and digital technologies for work, to solve problems that matter to them, and to express themselves creatively.
Related products


Leave your feedback...