
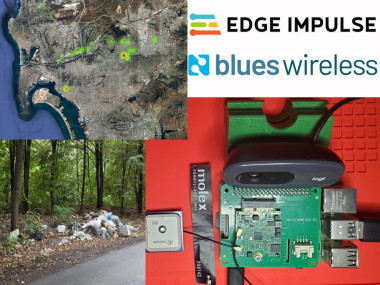
Build A Litter Heatmap With A Blues Notecard & Edge Impulse
Made by NathanielF
About the project
Learn how to create a prototype of a roadside litter detection device that maps trash in cities using Blues Wireless and Edge Impulse.
Project info
Difficulty: Expert
Platforms: Google, Raspberry Pi, Edge Impulse, Blues Wireless
Estimated time: 1 hour
License: MIT license (MIT)
Items used in this project
Hardware components

Software apps and online services
Story
The Problem
Litter build-ups are not only eye sores but can cause detrimental impacts on the local ecology. There are resources addressed to cleaning these build-ups; however, the current system uses citizen complaints to public services to designate pickup locations, which can be slow and ineffective.
In 2001, 200 million tax dollars were spent on picking up litter nationwide. The cost has only increased, with California’s Caltrans spending 102 million dollars on roadside pickup in the 2019 fiscal year alone. This project aims to solve that by creating a heatmap of trash in cities, which can be a more reliable measure of trash, and help locate where to direct these resources where they are most needed in a faster, more efficient way.
How Does it Work?

High Level Design
Using an image recognition model made in Edge Impulse Studio, I am able to classify whether images of the road contain trash or not. If there is trash, I use the Blues Wireless Notecard to get the GPS location and transmit the classification to the cloud.These devices are affordable, compact, and low-power, making them easy to attach to government or volunteer vehicles and passively collect data on trash as they are driven around.
Video on the Project
The Hardware

Hardware Unassembled
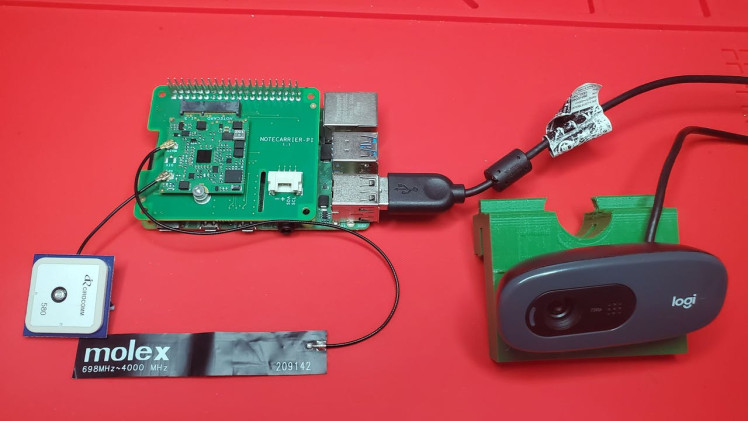
Hardware Assembled
For the hardware, I used a Raspberry Pi 4 to run an image recognition model (which has enough processing power to run the model fast while on the road), a camera to take the images (with a 3D-printed car window mount), the Blues Wireless Notecard (with the Notecarrier-Pi) to provide GPS and cellular connectivity, and an antennae for each connection. The hardware assembly is pretty straightforward as all components attach easily.
Why The Notecard?

Notecard
The Notecard from Blues Wireless can connect to cellular networks and GPS, making it perfect for creating a live map! Also, interfacing with the Notecard is pretty easy, especially with the Notecarrier expansion boards (in this case, the Notecarrier-Pi) and the easy-to-use Python library. The Notecard also has great connectivity to external services, as the cellular data from the device is routed through Notehub.io, which is then able to connect to a plethora of cloud services—allowing for a stream of data straight from the road to a centralized cloud. Also, the Notecard is affordable, as it comes with 500MB of free data.
Training the Model

Sample of Dataset

Collecting Data
I collected the data for the model from multiple sources, including the pLitter Dataset, images I took driving around San Diego, photos of trash, normal scenery from Google Maps (using gpx-streetview-imager), as well as an assortment of Google Images. The final training dataset comprised 298 images with litter and 466 images without litter.

Creating Edge Impulse Project
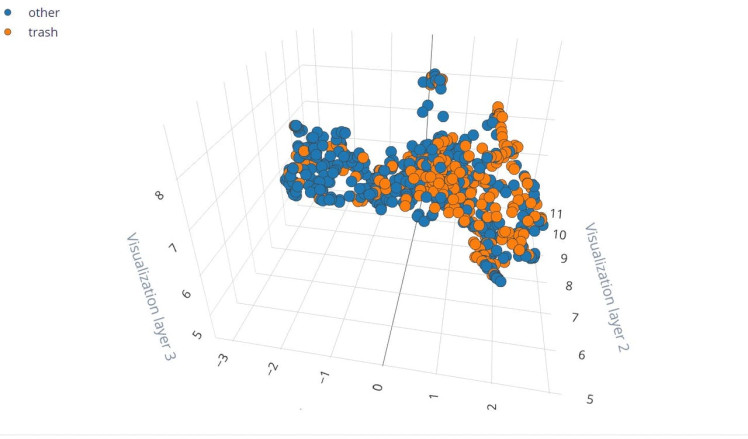
Feature Explorer
After collecting the dataset, I created a new project on Edge Impulse and uploaded the images. Edge Impulse automatically split the images into training and test datasets, and visualized the data in a feature explorer.

Test Accuracy

Model Architecture Found By EON Tuner
I then found and trained the best model using Edge Impulse’s EON Tuner, ending with a pretty good test accuracy of around 87%—much better than without using EON Tuner. Using Edge Impulse Studio made the process of data to model deployment and inference super convenient and straightforward, as well as providing the tools to make the best model for the dataset. The training of the model and dataset can be seen on Edge Impulse here.
With the model completed, you now have to install it on the Raspberry Pi. To do this, I used Edge Impulse’s Linux Python SDK. The setup can be found on Edge Impulse’s documentation for the SDK, but I’ll go over it here. First, install the SDK on the RPi using the following commands.
$ sudo apt-get install libatlas-base-dev libportaudio0 libportaudio2 libportaudiocpp0 portaudio19-dev
$ pip3 install edge_impulse_linux -i https://pypi.python.org/simple
Then install the quantized model to “model.eim” using edge-impulse-linux runner using the command below.
$ edge-impulse-linux-runner --quantized --download model.eimNow we have a trained model installed, but still have to write the inference for it.
Classifying Trash
We’ll go over the highlights of the code here, but you can see all of it on GitHub here. On the Raspberry Pi, I created two files, classifytrash.py and keys.py. For now, keys.py will be left empty as we don’t have the ProductUID yet.
First, we need to connect the Notecard to Notehub using the note-python library. The mode is set to periodic with a 30-minute outbound and 720-minute inbound, meaning that the Notecard periodically syncs outbound data with Notehub every 30 minutes and inbound data every 720 minutes.
req = {"req": "hub.set"}
req["product"] = keys.productUID
req["mode"]="periodic"
req["outbound"] = 30
req["inbound"] = 720
rsp = card.Transaction(req)
We then need to set the GPS to continuous mode to keep it always on as it is actively used when sending the location of trash.
req = {"req": "card.location.mode"}
req["mode"] = "continuous"
card.Transaction(req)
Before we start classifying images, we need to ensure the GPS is active (connected to enough satellites) or at least wait until it is active. To do this, we use a while loop that checks if the GPS is active before the main script runs.
def gpsActive():
    req = {"req": "card.location"}
    rsp = card.Transaction(req)
 if "{gps-active}" in rsp["status"] and "lat" in rsp and "lon" in rsp:
 return True
 else:
 return False

while not gpsActive():
    print("waiting for gps")
    time.sleep(30)
To continuously capture images and run the classification model on them, the script runs in a for loop based on frames.
for img in runner.get_frames(videoCaptureDeviceId):
 if (next_frame > now()):
                    time.sleep((next_frame - now()) / 1000)
When classifying the image, Edge Impulse makes deploying the model simple with only two function calls, generate_features, which converts the images into an input for the model, and runner.classify, which runs the inference on the images and returns the classification.
features = generate_features(cv2.resize(img, (160,160), interpolation=cv2.INTER_AREA))

res = runner.classify(features)
If trash is detected, the GPS location is pulled from the Notecard and added to the Notefile trash.qo, which queues it for outbound data under that label.
#get gps location
req = {"req": "card.location"}
rsp = card.Transaction(req)

#send the trash classification using the Notecard API
note.add(card,
         file="trash.qo",
         body={"trash": score, "lat": rsp["lat"], "lon": rsp["lon"]})
All we have to do to run the script is enter the command below.
$ python classifytrash.pyNow we need to set up the data pipeline to the cloud.
Connecting to the Cloud
We can create a heatmap of the detected trash points using Firestore and the Google Maps API. This part is the same as the “Pumping Data to the Cloud” section of Rob Lauer’s Cellular Signal Heatmap project, which mapped cellular signal quality similarly.
I. Google Cloud Platform

Creating Google Cloud Platform Project

Creation of Firestore Database

Creating Firestore Collection
The collection of images above follows the steps to create the Firestore.First,I started a new project on Google Cloud Platform. Then, under the Firestore tab, I created a Firestore in Native mode and selected the location closest to me. After the Firestore was built, I started a collection in the Firestore named “trashlocation”.

Configuration of Cloud Functions
Under the Cloud Functions tab, I created a function with the configuration in the above image. If you’re following along, make sure to select Allow unauthenticated invocations.
I then saved the URL, as it's needed to route the data to the function. In the Cloud Function, using the Inline Editor, I changed main.py to the following:
from google.cloud import firestore

def add_data(request):
 request_json = request.get_json()
 db = firestore.Client()
 db.collection(u'trashlocation').document().set(request_json)
 return ' ', 200
And added the following to requirements.txt:
google-cloud-firestore==2.0.2
After changing the entry point to add_data and deploying the cloud function, data from the Notecard is now routed from Notehub.io to the Firestore database.

Enabling Google Maps API
The only step left to do in Google Cloud Platform is setting up the Google Maps API for the heatmap later. Under the Google Maps Platform tab, I chose and enabled the Maps JavaScript API. After enabling it, I generated an API key under the Credentials tab and saved it for later.
III. Notehub
Flow of Data
Notehub is the essential intermediary step that connects to the Notecard, filters out irrelevant data points, and sends the data to the cloud.

Signing Up on Notehub.io

Creating a New Project
The series of images above show the steps you need to take on Notehub. First, to use Notehub, I signed up for an account on Notehub.io. I then created a new project named “trashdetection” and added the ProductUID to the keys.py file I made earlier.
productUID = "com.gmail.emailaddress:trashdetection”
Route Configuration

Filtering Notefiles to trash.qo

Transforming the Data
The series of images above show the steps to creating a Notehub Route. Under the Routes tab, I clicked “Create Route” and selected the Google Cloud Function option. The URL in the configuration is the exact URL saved from the Cloud Functions tab earlier; this is how you connect to the Cloud Function.
In Filters, under the Notefiles option, I chose “Selected Notefiles” and selected trash.qo. Filtering ensures that only the trash data is sent to Google Cloud Platform. Next, we need to transform the data as the full JSON has irrelevant data other than the body of the message. In Data, under the Transform Data option, I chose “JSONata Expression” and wrote the following:
{"trash": body.trash, "lat":body.lat,"lon":body.lon}
Trash Event in Notehub

Same Data Entry in Firestore
Displaying the Data
I. Setting Up Web Credentials

Creating Linked Project In Firebase Console

Registering the Web App in Firebase

Exported Firebase Config
To set up the web page, we first need to get the web credentials for the Firestore database at the Firebase console. I created a Firebase project that links to the Google Cloud Platform and Firestore database made previously. I then registered a web app in the Firebase project, named it “Heatmap”, and saved the firebaseConfig the registration generated. With the Firebase Config and the Google Maps API key, we now have all the credentials we need to create a keys.js file filled with the following:
const keys = {
 "googleMapsApiKey": "APIKEY",
 "firebaseConfig": {apiKey: "APIKEY",
    authDomain: "AUTHDOMAIN",
    projectId: "PROJECTID",
    storageBucket: "STORAGEBUCKET",
    messagingSenderId: "MESSAGINGSENDERID",
    appId: "APPID"},
}
II. Making the Web Page
With the credentials set up, we can now get started on the actual heatmap. Once again, we'll go over the highlights of the code here, but the entire thing can be seen on the project GitHub repository under the web folder here. There are three main JavaScript files—keys.js, initFirestore.js, and visualize.js—called in index.html.
<html>
  <head>
    <title>Trash Heatmap</title>
    <script src="https://polyfill.io/v3/polyfill.min.js?features=default"></script>
    <link rel="stylesheet" type="text/css" href="./style.css" />
    <script src="keys.js"></script>
  </head>
  <body>
    <div id="map"></div>
    <script type="module" src="./visualize.js"></script>
 </body>
</html>IninitFirestore.js,the document with all the trash locations is pulled from the Firestore and exported to visualize.js.
const app = initializeApp(keys.firebaseConfig);
const db = getFirestore(app);

export const trashData = () => {
 return getDocs(collection(db, "trashlocation"));
};
In visualize.js, each data point from the Firestore is placed into an array of Google Maps points.
querySnapshot.forEach((doc) => {
 if(doc.get('lat')){
 var lat = doc.get('lat').toFixed(6)
 var lon = doc.get('lon').toFixed(6)
      heatmapData.push(new google.maps.LatLng(lat, lon))
      heatmapDataWeighted.push({location: new google.maps.LatLng(lat, lon, doc.get('trash'))})
    }
})
After creating the array of Google Maps points, these points are placed into a heatmap visualization layer which is then displayed.
var heatmap = new google.maps.visualization.HeatmapLayer({
    data: heatmapData
});
heatmap.setMap(maps);
Final Map

Screenshot of Litter Heatmap
It works! Time to go pick up trash!
Conclusion
I’m delighted with how the project came out—the device is a pretty decent prototype of a litter mapping system. It would be possible to run this system on a wider scale and collect data that could save resources in litter pickup and help make smarter cities.
The process of making the ML model—from dataset to model inference—was made easily using Edge Impulse Studio, especially with tools like EON Tuner and the Linux Python SDK. While the model accuracy could be improved (possibly by expanding the dataset), the model already worked very well in most situations when I tested it on the road; the main problem seems to be false positives of trash in parking garages.
The Notecard made it effortless to create a capable device in a short time; the data pipeline from the edge to the cloud was extremely straightforward, with the Notecarrier-Pi to connect to the RPi, the simple-to-use Python library, and uncomplicated cloud integration in Notehub. To see more of the project, check out the video on the project here and the code here.
Leave your feedback...